Service Launch Troubleshooting Diagram – Efficient Operational Planning
RM0700001_11
- Last Update 02/25/2025
- File Size 1.2MB
- # of Slides 2
- File Format PPTX
- Slide Ratio 16:9
- Color
Keywords
About the Product
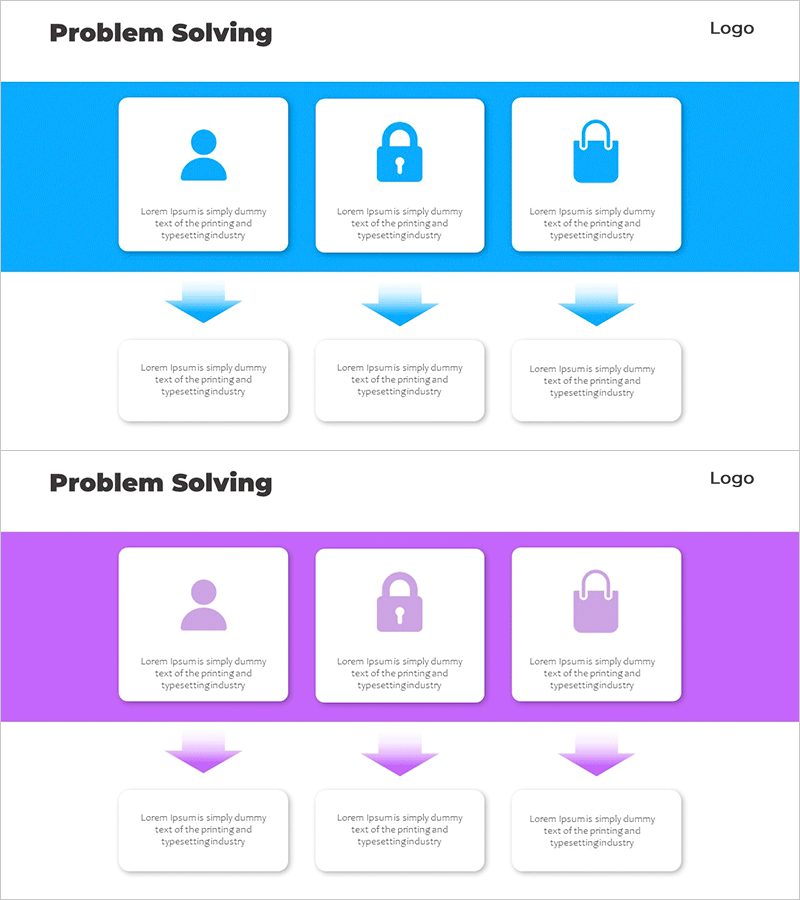
A PowerPoint slide that visualizes the step-by-step problem-solving process for service launch and operational management. This linear diagram addresses three critical areas—user experience, security, and shopping functionality—with clear problem identification and solution pathways. Each stage features an icon and dedicated text area for detailed explanations, making it ideal for presentations, business plans, and operational strategy documents. The 2-slide set is fully editable in PowerPoint, allowing you to customize colors, icons, and text to match your brand and messaging requirements.
Usage Points
-
Main Usage
Systematically identify and address potential challenges during service launch across three key areas—user experience, security, and shopping—while presenting step-by-step solutions. Enables clear communication of operational response strategies to stakeholders and decision-makers.
-
How to Use
Insert this diagram into the operational strategy or business planning section of your presentation. Replace placeholder text under each stage icon with specific problems and corresponding solutions relevant to your service launch. Use the visual flow to guide audiences through your problem-solving methodology.
-
Recommended For
Service planning teams, operations managers, and business development professionals presenting to executives or investors. Suitable for startup business plans, corporate service launch reports, operational improvement proposals, and strategic planning presentations.
-
Slide Structure
Two-slide layout with a blue header section containing three icons (user, security, shopping) connected by downward-pointing blue arrows to three corresponding text boxes below. Each box provides an independent text input area for customized content, maintaining visual consistency across the diagram.
Related Products
-

Infographic Template for Issue Resolution – Practical Guide
#Operational Plan #Technical Approach #Diagram
-

Solution Process Diagram - Business Support and Operational Planning
#Operational Plan #Diagram #Mitigation Measures
-

Effective Solutions for Business Growth – Success and Innovation
#Business Strategy #Operational Plan #Diagram
-

PowerPoint Slide for Types of Trees
#Operational Plan #Mitigation Measures #Business Support Plan
