Key Financial Indicators Analysis Diagram – Efficient Financial Planning
RM0600007_28
- Last Update 02/25/2025
- File Size 0.2MB
- # of Slides 2
- File Format PPTX
- Slide Ratio 16:9
- Color
Keywords
About the Product
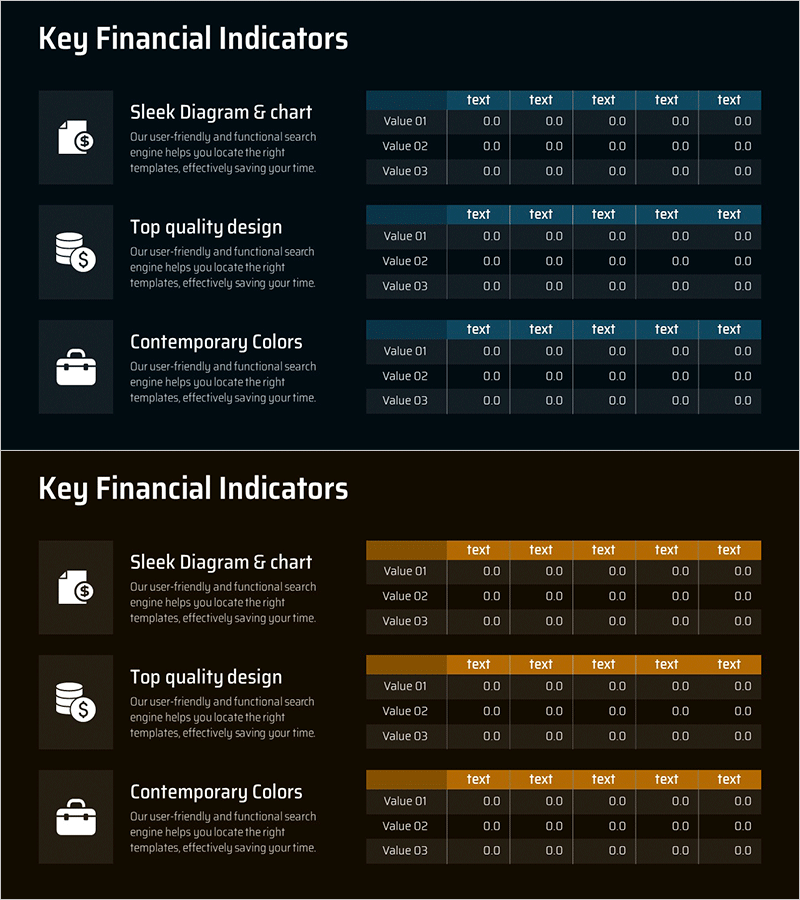
A professional PowerPoint slide for presenting key financial metrics in a structured format. The layout features three icons with descriptive text on the left side, paired with a 3-row by 5-column data table on the right. Designed for financial analysis, investor presentations, and executive reports. Two color themes (dark blue and dark brown) are included, with fully editable table headers and data cells. Perfect for quarterly earnings reports, investment pitches, and financial performance dashboards. Ready to use as presentation slides or financial documentation.
Usage Points
-
Main Usage
Display and compare key financial performance metrics, investment returns, and quarterly results in a clear, structured format. Enables executives, investors, and board members to quickly understand financial health and performance trends.
-
How to Use
Enter financial metric names (revenue, net income, ROI, etc.) in the left icon area and corresponding numerical values in the right table by quarter or year. Select a color theme matching your corporate brand and combine with charts or graphs for enhanced financial section readability.
-
Recommended For
CFOs, finance teams, and investor relations professionals preparing quarterly earnings presentations, investor relations materials, and executive financial reports. Ideal for startup fundraising, M&A documentation, and financial performance analysis presentations.
-
Slide Structure
Left section: 3 icons with text descriptions. Right section: 3-row 5-column data table with editable header row and three data rows. Table headers use dark blue or dark brown color coding for visual hierarchy and easy data entry.
Related Products
-

Grain Yield Table – Financial Planning and Performance
#Financial Plans and Performance #Diagram #Sales and Revenue
-

Farm Key Financial Indicators Table Chart – Intuitive Presentation of Financial Performance
#Financial Plans and Performance #Diagram #Sales and Revenue
-

Orange Red Point Table – Visualization of Financial Performance
#Financial Plans and Performance #Diagram #Sales and Revenue
-

Capital Sales Analysis Graph – Visualizing Financial Performance
#Financial Plans and Performance #Diagram #Graph
