Business Profit Analysis Table – Financial Performance and Strategy Analysis
RJ0300070_29
- Last Update 05/08/2025
- File Size 0.5MB
- # of Slides 2
- File Format PPTX
- Slide Ratio 16:9
- Color
Keywords
- #Content-Based Slides
- #Design-Based Slides
- #Financial Plans and Performance
- #Diagram
- #Sales and Revenue
- #Key Financial Indicators
- #Cluster
- #Table
- #Closed Cluster Diagram
- #16:9
- #closed diagram PowerPoint
- #business analysis slide
- #financial performance presentation
- #two-element comparison diagram
- #business revenue analysis template
- #financial metrics PowerPoint slide
About the Product
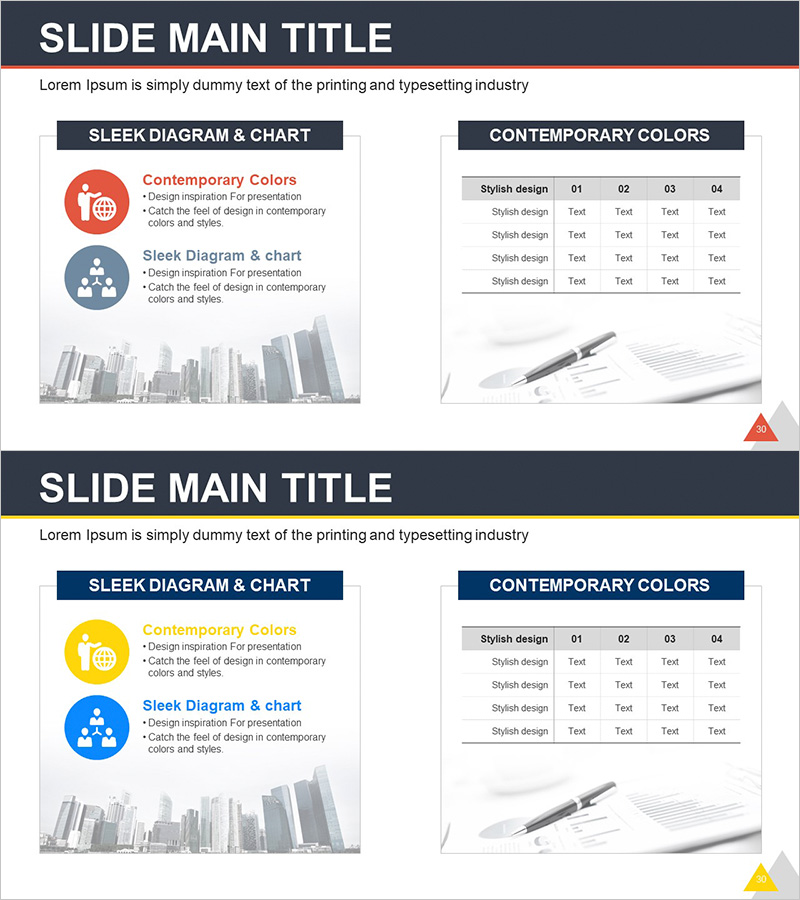
A 2-slide PowerPoint set for visualizing business revenue analysis and financial strategy. The closed-form diagram structure presents two key elements (Contemporary Colors and Sleek Diagram & Chart) in a side-by-side comparison layout. Red and blue circular icons paired with gray-toned table areas create a professional business aesthetic, enhanced by cityscape imagery and pen mockup visuals. Ready to use in presentations, this slide deck is structured for financial performance analysis, key metrics explanation, and strategic comparison. Color variants (red/blue/yellow) allow customization for different presentation contexts.
Usage Points
-
Main Usage
Optimized for financial performance analysis, key metrics comparison, and business strategy presentation. The closed-form structure contrasts two core elements to clearly present decision-making options. Effectively communicates financial status and strategic direction to investors, executives, and team members.
-
How to Use
On slide 1, designate the Contemporary Colors (red circle) and Sleek Diagram & Chart (blue circle) as two analytical perspectives. Replace text and table data with actual financial figures and metrics matching your presentation context. On slide 2, add supplementary comparison items or detailed analysis content as needed.
-
Recommended For
Ideal for CFOs, finance managers, executives, investment officers, and business analysts presenting business performance reports, investment pitches, and management meetings. Particularly effective when comparing two scenarios, strategies, or performance outcomes simultaneously.
-
Slide Structure
2-slide composition. Slide 1: Title area + left closed diagram (red circular icon + 3-line text) + right closed diagram (blue circular icon + 3-line text) + bottom cityscape image. Slide 2: Title area + left diagram section + right 4×4 table (Stylish design 01–04 items) + bottom pen mockup image. 16:9 widescreen format, PPTX file.
Related Products
-

Financial Services Revenue Analysis Table – Intuitive Financial Data Visualization
#Financial Plans and Performance #Diagram #Sales and Revenue
-

Sales and Profit Table – Statistical Financial Performance
#Financial Plans and Performance #Diagram #Sales and Revenue
-

Orange Red Point Table – Visualization of Financial Performance
#Financial Plans and Performance #Diagram #Sales and Revenue
-

Key Financial Indicators by Sector – Concise and Stylish Design
#Financial Plans and Performance #Diagram #Sales and Revenue
