Outlook Analysis Graph for Market and Competitive Analysis
RM0600007_17
- Last Update 02/25/2025
- File Size 0.2MB
- # of Slides 2
- File Format PPTX
- Slide Ratio 16:9
- Color
Keywords
About the Product
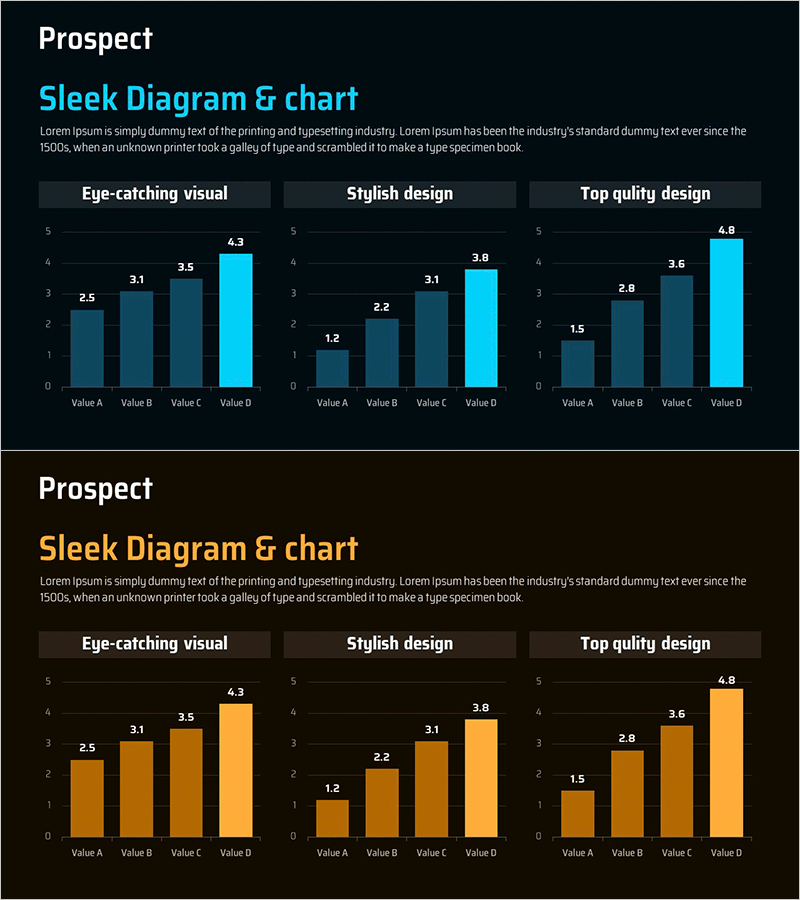
Outlook analysis graph for market and competitive analysis PowerPoint slide set. This 2-slide presentation features horizontal bar charts on a dark blue background with light blue accent colors, comparing four data values (Value A through D) across three evaluation criteria: Eye-catching visual, Stylish design, and Top quality design. Each chart includes clear data labels for precise numerical comparison. Ready-to-use for business presentations, market reports, and strategic planning documents.
Usage Points
-
Main Usage
Visualizes quantitative comparison of four data items (such as market size, competitor performance, or departmental results) using horizontal bar format. Bar length and data labels enable quick numerical comparison and trend identification across categories.
-
How to Use
Insert into business plans, marketing proposals, quarterly performance reports, and competitive analysis sections. Edit slide titles and data values to reflect your actual analysis results. Immediately usable as presentation material without additional design work.
-
Recommended For
Marketing teams, strategy departments, sales teams presenting market analysis, executive reports, investor presentations, and consulting proposals. Ideal for any business presentation requiring quantitative comparative analysis.
-
Slide Structure
2-slide set. Each slide contains a title area plus three evaluation-based horizontal bar chart sections. Each chart displays four data items (Value A–D) with bars and numerical labels. The final item (Value D) is highlighted in light blue to emphasize the highest value.
Related Products
-

Market Status and Future Outlook – Data Illustrated in Blue and Yellow
#Market and Competitor Analysis #Graph #Market Status
-

Bar Chart Visualizing Yacht Tour Satisfaction
#Market and Competitor Analysis #Graph #Other
-

Successful Proposition Strategy through Market and Competitive Analysis
#Market and Competitor Analysis #Graph #Market Status
-

Horizontal Bar Chart for Recent Case Receipt Trends – Market Status
#Market and Competitor Analysis #Graph #Market Status
