Market Status Graph Blue Bluegreen – Horizontal Bar Chart Template for Visualizing Market Trends
RJ0400005_6
- Last Update 05/18/2025
- File Size 0.2MB
- # of Slides 2
- File Format PPTX
- Slide Ratio 16:9
- Color
Keywords
About the Product
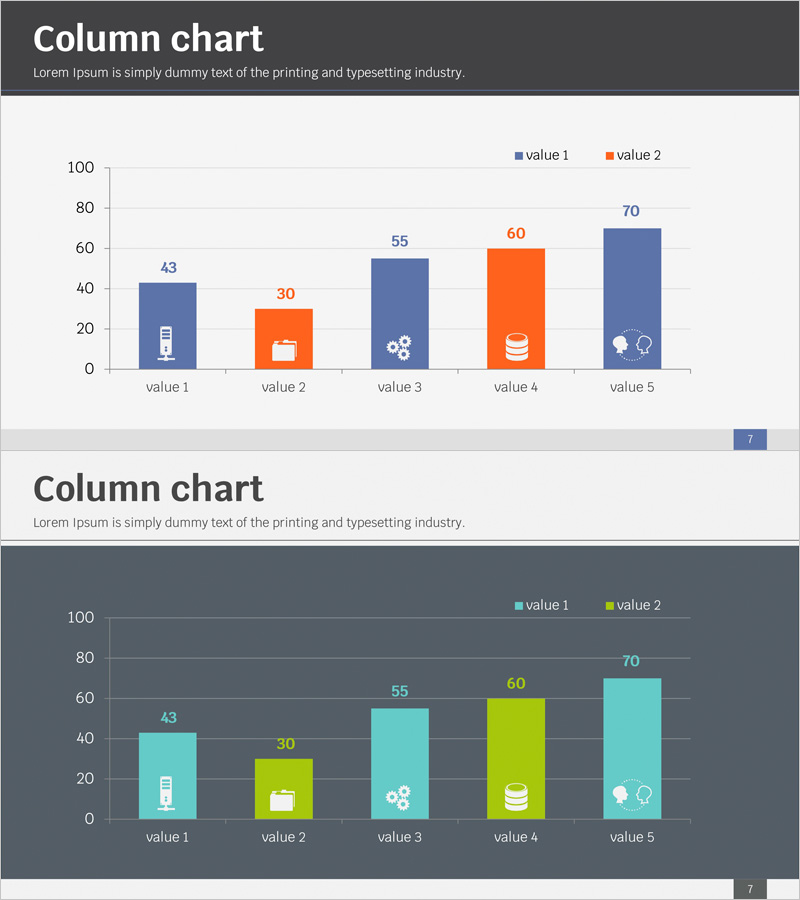
A vertical column chart PowerPoint slide that clearly visualizes market status and trends across multiple data points. Featuring blue and cyan color schemes representing two data series across five categories, with numerical labels (43, 30, 55, 60, 70) displayed above each column for precise information delivery. Icons integrated within each column (mobile device, document, network, database, lightbulb) enhance intuitive understanding of category meanings, while a clean background and visible grid lines maximize data readability. This presentation slide is ready for immediate use in marketing reports, business analysis presentations, and market research briefings.
Usage Points
-
Main Usage
Compares numerical data across two series—such as market conditions, sales performance, quarterly results, or competitive analysis—by dividing five categories into paired columns. The height difference between bars reveals rankings, trends, and gaps at a glance, while numerical labels simultaneously communicate exact values.
-
How to Use
Apply to market analysis sections in marketing reports, quarterly performance presentations, market overview pages in business plans, and market size explanations in investor pitch decks. Directly edit data values in PowerPoint to instantly update the chart with your actual figures.
-
Recommended For
Marketing managers, sales directors, business planning teams, financial analysts, and consultants requiring data-driven decision-making. Particularly effective for quarterly/monthly/regional performance comparisons, product-line sales analysis, and competitive landscape explanations.
-
Slide Structure
Title area at top, legend (value 1 blue, value 2 cyan), five categories (value 1–5) with paired vertical columns, numerical labels above each column, Y-axis scale (0–100) on left, category names at bottom. Icons within each column reinforce category meaning. Two-slide set includes light background and dark background versions.
Related Products
-

Tourist Destination Preference Analysis – Stylish Bar Chart Design
#Market and Competitor Analysis #Graph #Market Status
-

Weather Bar Graph - Market Status Analysis
#Market and Competitor Analysis #Graph #Market Status
-

Bar Chart Visualizing Yacht Tour Satisfaction
#Market and Competitor Analysis #Graph #Other
-

Real Estate Sales and Consumer Analysis Slide
#Market and Competitor Analysis #Graph #Market Status
