Growth Prospects Graph – Business Strategy Development
RJ0600094_11
- Last Update 07/16/2025
- File Size 0.3MB
- # of Slides 2
- File Format PPTX
- Slide Ratio 16:9
- Color
Keywords
- #Content-Based Slides
- #Design-Based Slides
- #Business Strategy
- #Market and Competitor Analysis
- #Graph
- #Text Box
- #Financial Outlook & Expected Impact
- #Future Outlook
- #Column
- #Column Chart
- #Rounded Rectangle Text Box
- #16:9
- #growth chart PowerPoint slide
- #bar graph presentation template
- #business strategy visualization
- #growth trend diagram
- #gradient chart download
About the Product
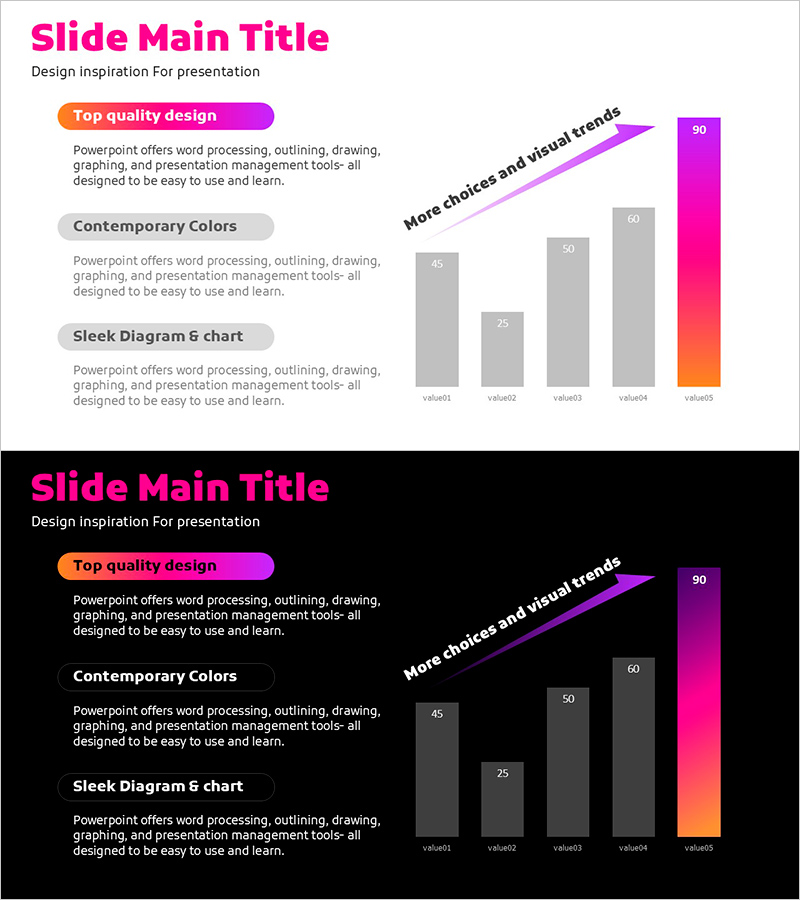
A 5-step bar chart PowerPoint slide that visualizes business growth prospects and market performance. The gradient color scheme transitions from orange to purple, emphasizing upward momentum with a diagonal arrow. Each stage displays clear numerical values (25, 45, 50, 60, 90) for data comparison. Three text boxes on the left side allow you to add key messages for each phase. The 2-slide set includes both light and dark background versions, making it adaptable to any presentation environment. Fully editable PPTX format for immediate customization.
Usage Points
-
Main Usage
Effectively communicate business growth forecasts, market analysis results, revenue trends, and milestone achievements using a 5-stage bar chart. The gradient color palette and upward arrow reinforce positive growth messaging, while left-aligned text boxes provide space for stage-specific explanations.
-
How to Use
Use in business plans, investor pitch decks, quarterly performance reports, and marketing strategy presentations. Simply replace the bar values with your own data and add relevant descriptions in the text boxes for each growth stage.
-
Recommended For
Ideal for executives, business managers, marketing teams, and investor presentations. Particularly effective for quarterly or annual growth reports, new business proposals, and strategic planning documents.
-
Slide Structure
2-slide set with 5-bar chart (values: 25, 45, 50, 60, 90), one diagonal upward arrow, and three left-aligned text boxes per slide. Light background and dark background versions included for flexible presentation contexts.
Related Products
-

Column Chart for Market and Competitor Analysis – Modern Business Strategy
#Business Strategy #Market and Competitor Analysis #Graph
-

Comparison Graph Before and After Growth – Business Insights
#Business Strategy #Market and Competitor Analysis #Graph
-

Future Outlook Vertical Bar Graph – Business Strategy Analysis
#Business Strategy #Market and Competitor Analysis #Graph
-

Technology Service Future Outlook and Expected Effect – High-Quality Graph Design
#Business Strategy #Market and Competitor Analysis #Graph
