Market Analysis with 3 Line Charts – Data-Driven Future Forecasting
RJ0900017_23
- Last Update 08/20/2025
- File Size 1.2MB
- # of Slides 2
- File Format PPTX
- Slide Ratio 16:9
- Color
Keywords
About the Product
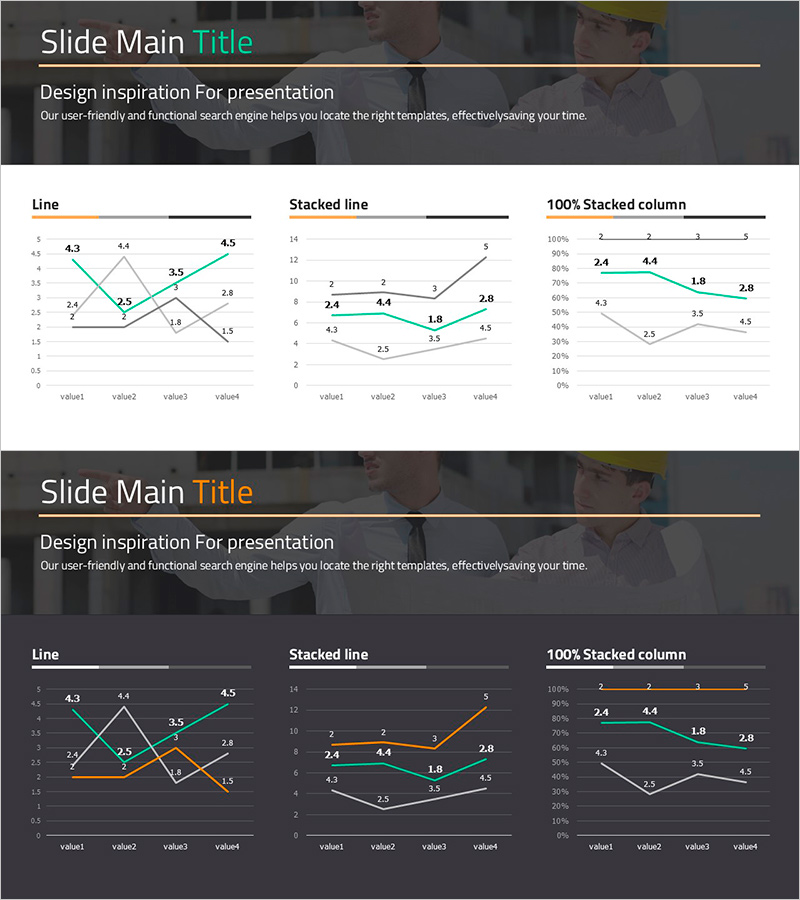
A comprehensive PowerPoint slide set featuring three distinct line chart types for market analysis and future forecasting. Includes a standard line chart, stacked line chart, and 100% stacked column chart, each displaying four data points with clear numerical labels. The slide deck provides two design versions—light background and dark background—allowing seamless integration with your presentation theme. Each chart is fully editable, enabling you to input your own data values, categories, and legend labels. Ideal for executive reports, investor presentations, quarterly business reviews, and strategic planning sessions where data-driven insights are essential.
Usage Points
-
Main Usage
Visualize time-series data such as market trends, competitive benchmarking, revenue progression, and growth rates across three complementary chart formats. The explicit data labels and legend ensure complex datasets are immediately comprehensible to executives and stakeholders, supporting data-driven decision-making.
-
How to Use
Deploy in quarterly business reviews, investor pitch decks, market analysis presentations, and executive briefings. Double-click any chart to edit data values, categories, and colors directly within PowerPoint. Choose the light or dark background version based on your presentation theme, then customize colors and fonts to match corporate branding guidelines.
-
Recommended For
Financial analysts, marketing managers, business consultants, strategy officers, investor relations professionals, and data-driven decision-makers. Particularly effective for performance reporting, market entry strategy presentations, fundraising pitches, and competitive landscape analysis.
-
Slide Structure
Two-slide deck with identical chart layouts on contrasting backgrounds. Slide 1 features light background with three charts (line, stacked line, 100% stacked column); Slide 2 mirrors the layout on dark background. Each chart contains four data categories (value1–value4) with editable numerical labels and legend fields.
Related Products
-

Industrial Market Outlook Analysis Graph – Market Status and Growth Potential
#Market and Competitor Analysis #Graph #Market Status
-

IT Industry Market Outlook Analysis Graph – Current Market Status and Future Prospects
#Market and Competitor Analysis #Diagram #Graph
-

Medical Services Characteristics Connection Diagram
#Market and Competitor Analysis #Graph #Market Status
-

Two Comparison Line Graphs – Market Status and Future Outlook
#Market and Competitor Analysis #Graph #Market Status
