Product Segmentation Analysis Chart – Market Analysis and Strategy
RM0600007_13
- Last Update 02/25/2025
- File Size 0.2MB
- # of Slides 2
- File Format PPTX
- Slide Ratio 16:9
- Color
Keywords
- #Content-Based Slides
- #Design-Based Slides
- #Business Strategy
- #Market and Competitor Analysis
- #Graph
- #Production Plan
- #Market Analysis
- #Horizontal Bar
- #Segmented Horizontal Bar
- #16:9
- #product segmentation analysis chart PowerPoint
- #stacked bar graph presentation
- #market analysis slide template
- #quarterly revenue dashboard
- #product portfolio analysis template
About the Product
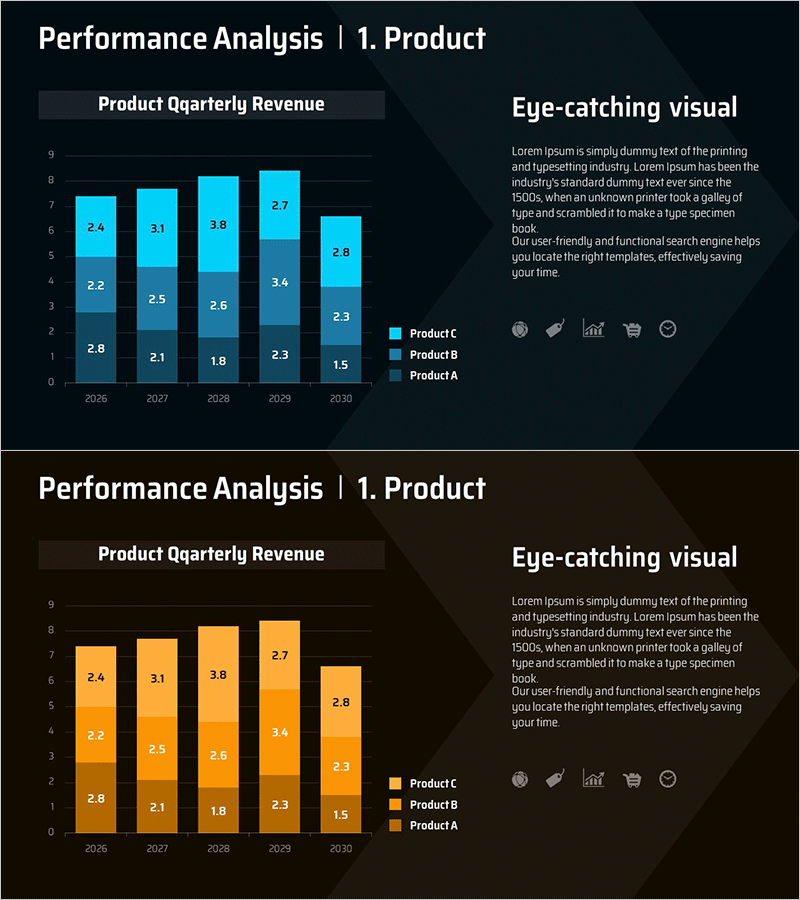
A stacked bar chart PowerPoint slide designed for product segmentation analysis across five years (2026–2030) with quarterly breakdowns. The dark background features blue and orange color schemes, displaying revenue trends for three product lines (Product A, B, C) in a layered structure for easy comparison. The right side includes an 'Eye-catching visual' section with key messaging and icons to reinforce presentation points. This 2-slide set integrates seamlessly into market analysis and business strategy sections, with fully editable colors, data values, and text fields for customization.
Usage Points
-
Main Usage
Present quantitative analysis of product portfolio segmentation and clearly communicate each product line's market position and growth trajectory. This slide enables executives, investors, and team members to understand business performance and strategic direction through layered data visualization of quarterly revenue by product category.
-
How to Use
Insert into business plans, investor pitch decks, or quarterly performance reports within the market analysis or business strategy section. Replace sample data with actual revenue figures, update product names and colors to match your portfolio, and customize the right-side text area with key insights or strategic messages for a data-driven presentation.
-
Recommended For
Executives, business development teams, marketing departments, and finance teams presenting quarterly performance analysis, product-level ROI evaluation, and portfolio optimization strategies. Particularly effective for mid-sized and large enterprises with multi-product portfolios during board meetings, investor relations events, and internal strategy sessions.
-
Slide Structure
Slide 1: Title + 5-year quarterly stacked bar chart (2026–2030) with 3 product lines color-coded + right-side 'Eye-catching visual' text zone. Slide 2: Identical layout with alternate orange color scheme. Each bar is divided into 3 tiers showing product contribution, with legend and numeric labels included for clarity.
Related Products
-

Sales Growth Rate and Profit Change Analysis Chart – Emphasizing Business Performance
#Business Strategy #Market and Competitor Analysis #Diagram
-

Product Performance Analysis Segmented Graph – Strengthening Market Competitiveness
#Business Strategy #Market and Competitor Analysis #Diagram
-

Bar Graph Visualization of Workplace Preferences
#Product/Service Introduction #Market and Competitor Analysis #Graph
-

Segmented Bar Graph for Market Analysis Visualization
#Market and Competitor Analysis #Graph #Market Analysis
