Product Performance Analysis Segmented Graph – Strengthening Market Competitiveness
RM0600004_13
- Last Update 02/24/2025
- File Size 0.3MB
- # of Slides 2
- File Format PPTX
- Slide Ratio 16:9
- Color
Keywords
- #Content-Based Slides
- #Design-Based Slides
- #Business Strategy
- #Market and Competitor Analysis
- #Diagram
- #Graph
- #Production Plan
- #Market Analysis
- #Table
- #Horizontal Bar
- #Segmented Horizontal Bar
- #16:9
- #segmented bar chart PowerPoint
- #stacked bar graph slide template
- #product performance analysis chart
- #market analysis PowerPoint slide
- #business comparison chart download
About the Product
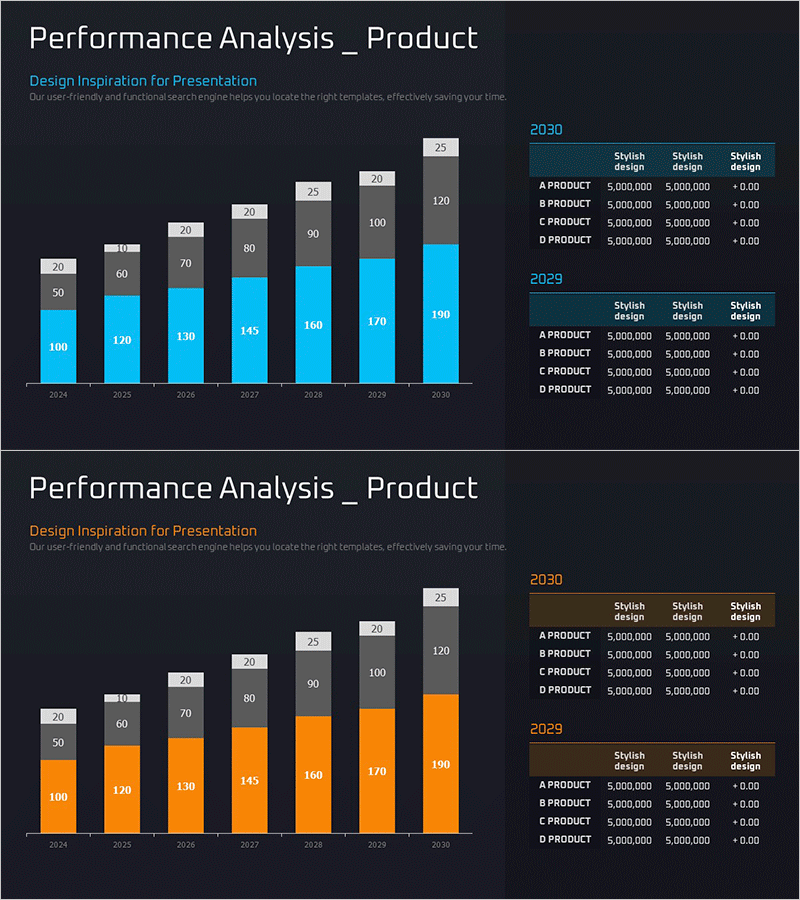
A segmented bar chart PowerPoint slide that compares product performance across four data series from 2024 to 2030. Each year displays stacked bars with gray and cyan segments, clearly distinguishing primary and secondary metrics through color contrast. Data labels appear at the top of each bar and within segments for precise value communication. The right panel includes performance tables for 2030 and 2029, showing product A through D with style-specific metrics and percentage changes. This slide is ready to use in business reports, quarterly reviews, and competitive analysis presentations for market positioning strategies.
Usage Points
-
Main Usage
Visualizes product performance data across four segments over seven years, enabling year-over-year trend analysis and segment contribution comparison. The stacked format shows both total volume and individual segment proportions, while the accompanying data table provides quantitative support for strategic decisions.
-
How to Use
Insert this slide into business reports, quarterly earnings presentations, and market analysis decks in the performance review or competitive positioning section. Replace sample data with actual figures, update the right-side tables with current metrics, and adjust segment labels to match your product categories.
-
Recommended For
Product managers, marketing directors, sales leaders, and business analysts presenting market performance and product portfolio analysis. Particularly effective for quarterly business reviews, investor presentations, and internal strategy meetings where data-driven comparisons are essential.
-
Slide Structure
Left side features a 7-year stacked bar chart (2024–2030) with four segments per year rendered in gray and cyan. Top labels show cumulative totals; segment labels display individual values. Right side contains two tables: 2030 performance (top) and 2029 performance (bottom), each listing products A–D with style design columns showing 5,000,000-unit values and ±0.00 change rates.
Related Products
-

Sales Growth Rate and Profit Change Analysis Chart – Emphasizing Business Performance
#Business Strategy #Market and Competitor Analysis #Diagram
-

Industry-leading Key Performance Analysis Charts
#Company Introduction #Market and Competitor Analysis #Diagram
-

Simple Cement Theme Analysis Chart – Understanding Competitor and Market Context
#Market and Competitor Analysis #Diagram #Graph
-

Shareholder Status Analysis Data Chart – Insights and Market Analysis
#Company Introduction #Market and Competitor Analysis #Diagram
