Sales Growth Rate and Profit Change Analysis Chart – Emphasizing Business Performance
RM0600002_13
- Last Update 02/23/2025
- File Size 1.1MB
- # of Slides 2
- File Format PPTX
- Slide Ratio 16:9
- Color
Keywords
- #Content-Based Slides
- #Design-Based Slides
- #Business Strategy
- #Market and Competitor Analysis
- #Diagram
- #Graph
- #Production Plan
- #Market Analysis
- #Table
- #Horizontal Bar
- #Segmented Horizontal Bar
- #16:9
- #sales growth rate chart PowerPoint
- #profit analysis slide template
- #bar graph presentation
- #business performance dashboard PPT
- #data visualization slides
About the Product
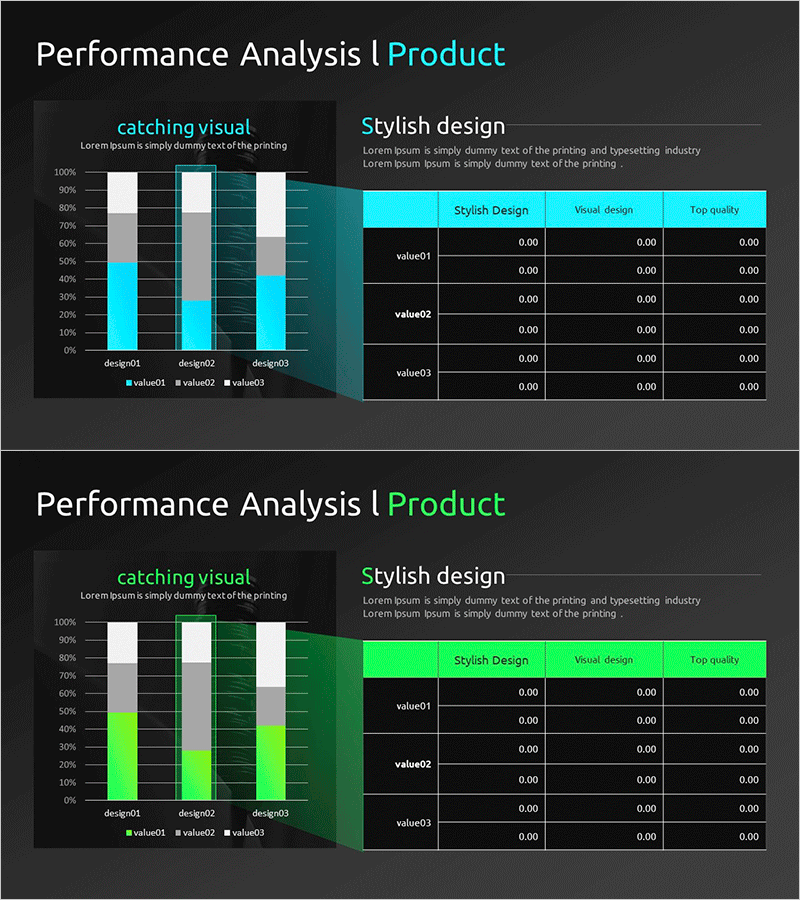
A comprehensive PowerPoint slide set for visualizing business performance through sales growth rate and profit change analysis charts. This presentation includes two chart types: vertical bar graph and horizontal bar graph, each displaying three design items (design01~design03) and three data series (value01~value03) against a dark background with cyan and green accent colors. The dual-chart approach enables simultaneous comparison of multiple metrics such as revenue, profit margin, and growth rate. Delivered in 16:9 widescreen PPTX format with fully editable elements, this slide template is ideal for quarterly earnings presentations, investor reports, executive dashboards, and strategic performance reviews.
Usage Points
-
Main Usage
Designed to compare quarterly and annual sales growth rates alongside profit fluctuations, enabling clear communication of business performance to executives, investors, and team members. The dual-chart format (vertical and horizontal bars) provides flexible data interpretation and presentation options.
-
How to Use
Open the slide and replace design01~design03 labels and value01~value03 figures with your actual data. The cyan and green color scheme emphasizes positive growth, making it suitable for earnings reports, quarterly reviews, and executive dashboard sections. Colors and data series can be customized as needed.
-
Recommended For
CFOs, finance managers, executives, and investor relations professionals presenting quarterly or annual financial performance. Also valuable for marketing teams conducting sales channel performance comparisons, product profitability analysis, and multi-metric performance reviews.
-
Slide Structure
2-slide set. Slide 1: Vertical bar chart with 3 design items × 3 data series (9 data points) plus legend. Slide 2: Horizontal bar chart with identical structure plus data table (5 rows × 3 columns). Dark background with cyan and green accents and white text for high contrast visibility.
Related Products
-

Product Performance Analysis Segmented Graph – Strengthening Market Competitiveness
#Business Strategy #Market and Competitor Analysis #Diagram
-

Industry-leading Key Performance Analysis Charts
#Company Introduction #Market and Competitor Analysis #Diagram
-

Product Segmentation Analysis Chart – Market Analysis and Strategy
#Business Strategy #Market and Competitor Analysis #Graph
-

Segmented Horizontal Bar Charts and Tables – Optimal Data Visualization for Market Analysis
#Market and Competitor Analysis #Diagram #Graph
