Chart of Industry Change and Global Market Outlook Analysis
RM0600002_9
- Last Update 02/23/2025
- File Size 1.2MB
- # of Slides 2
- File Format PPTX
- Slide Ratio 16:9
- Color
Keywords
- #Content-Based Slides
- #Design-Based Slides
- #Market and Competitor Analysis
- #Graph
- #Market Analysis
- #Industry Trends
- #Horizontal Bar
- #Circles
- #Horizontal Bar Chart
- #Pie Chart
- #16:9
- #pie chart PowerPoint slide
- #market analysis presentation
- #industry trend chart
- #pie graph template
- #ratio analysis slide
About the Product
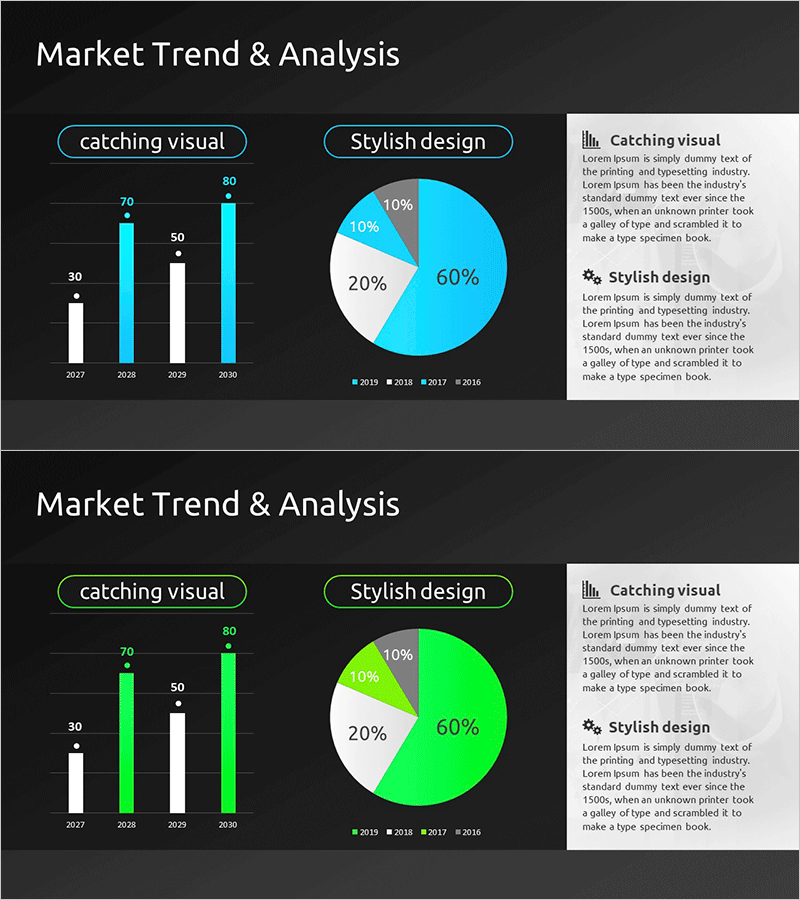
A 2-slide PowerPoint presentation analyzing industry change and global market outlook. This slide deck combines a cyan pie chart with a vertical bar graph to visualize market data effectively. The bar graph displays a 4-year trend from 2027 to 2030, while the pie chart shows proportional composition across four time periods (2019-2016) with 60%, 20%, 10%, and 10% segments. The dark background with bright cyan accents creates strong visual contrast for professional presentations. Delivered in 16:9 widescreen PPTX format, fully editable and ready to customize with your own data.
Usage Points
-
Main Usage
Designed to present market analysis, industry trends, and proportional data at a glance. The pie chart clearly shows compositional ratios while the bar graph illustrates temporal trends. Ideal for executive briefings, investor presentations, and market analysis reports.
-
How to Use
Slide 1 features a bar graph and pie chart side-by-side for simultaneous market size and composition comparison. Slide 2 presents the same layout with a green color variant for design flexibility. Double-click chart elements to edit data values directly, and customize legend labels and axis titles as needed.
-
Recommended For
Executives, marketing professionals, business analysts, consultants, and investor relations teams presenting market conditions and forecasts. Suitable for quarterly earnings reports, new business proposals, competitive analysis, and industry research presentations.
-
Slide Structure
Slide 1: Title area + left vertical bar graph (4 years, 4 data series) + right pie chart (3 segments: 60%, 20%, 10%, 10%) + right text description box. Slide 2: identical layout with green color scheme applied. All chart elements are individually selectable and color-customizable.
Related Products
-

Latest Trend Analysis Bar & Donut Charts
#Market and Competitor Analysis #Graph #Market Analysis
-

Service Market Trends and Analysis Slide (Red and Blue)
#Market and Competitor Analysis #Diagram #Graph
-

Market Trend Analysis Diagram – Effective Material for Strategy Development
#Market and Competitor Analysis #Diagram #Graph
-

Space Industry Analysis Graph Chart – Market and Competitive Analysis
#Market and Competitor Analysis #Graph #Customer Analysis
