Service Market Trends and Analysis Slide (Red and Blue)
RJ0400028_8
- Last Update 05/25/2025
- File Size 1MB
- # of Slides 2
- File Format PPTX
- Slide Ratio 16:9
- Color
Keywords
- #Content-Based Slides
- #Design-Based Slides
- #Market and Competitor Analysis
- #Diagram
- #Graph
- #Market Analysis
- #Industry Trends
- #Table
- #Horizontal Bar
- #Standard Table
- #Horizontal Bar Chart
- #16:9
- #horizontal bar chart PowerPoint
- #market trend analysis slide
- #time series data presentation
- #5-year trend graph
- #bar chart template download
About the Product
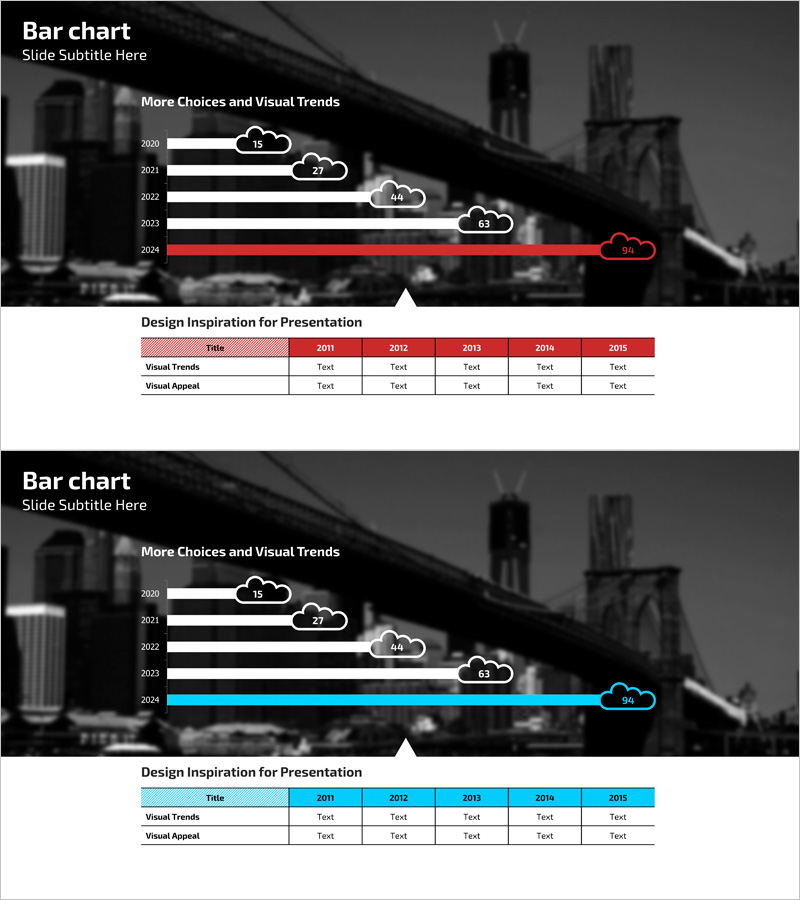
A horizontal bar chart PowerPoint slide that visualizes service market trends across five years from 2020 to 2024. The slide uses a red and blue dual-tone color scheme to clearly distinguish year-over-year data, with cloud-shaped labels at the end of each bar displaying numerical values for enhanced clarity. The lower section includes an analysis table documenting visual trends and visual appeal, making it immediately ready for presentation use. Provided as a 2-slide set in 16:9 widescreen format, with fully editable colors and data fields for customization.
Usage Points
-
Main Usage
Visualizes year-over-year market data such as market size, growth rate, and market share using a horizontal bar chart format. The red and blue dual-tone color scheme distinguishes contrasting data series, while cloud-shaped labels emphasize precise numerical values for clear trend comparison.
-
How to Use
Ideal for business plans, market analysis reports, and investor pitch presentations. Use when explaining market size trends, competitive growth rate comparisons, and industry growth forecasts. The accompanying analysis table helps summarize visual trends and key insights, enhancing audience comprehension.
-
Recommended For
Best suited for marketing managers, strategists, executives, and investor presentations. Effective in situations requiring quantitative data-driven decision-making such as market analysis, competitive analysis, and performance reporting.
-
Slide Structure
Slide 1: Title area + 5-year horizontal bar chart (2020–2024) with cloud-shaped numerical labels. Slide 2: Title + 5-column analysis table (2011–2015) with 2 rows (Visual Trends, Visual Appeal). 16:9 aspect ratio, 2-slide set.
Related Products
-

Market Trend Analysis Chart – Effective Data Visualization
#Market and Competitor Analysis #Graph #Market Analysis
-

Stylish Bar Chart Slide Design
#Market and Competitor Analysis #Diagram #Graph
-

Blue Green Horizontal Bar Graph – Optimized for Market and Competitive Analysis
#Market and Competitor Analysis #Diagram #Graph
-

Performance Analysis 3D Bar Chart & Table – Market and Performance Analysis
#Company Introduction #Market and Competitor Analysis #Diagram
