Latest Trend Analysis Bar & Donut Charts
RM0600003_9
- Last Update 02/23/2025
- File Size 0.3MB
- # of Slides 2
- File Format PPTX
- Slide Ratio 16:9
- Color
Keywords
- #Content-Based Slides
- #Design-Based Slides
- #Market and Competitor Analysis
- #Graph
- #Market Analysis
- #Industry Trends
- #Horizontal Bar
- #Circles
- #Horizontal Bar Chart
- #Doughnut Chart
- #16:9
- #donut chart PowerPoint
- #bar graph template
- #market analysis slide
- #trend analysis chart
- #data visualization PPT
- #pie and bar chart slide design
About the Product
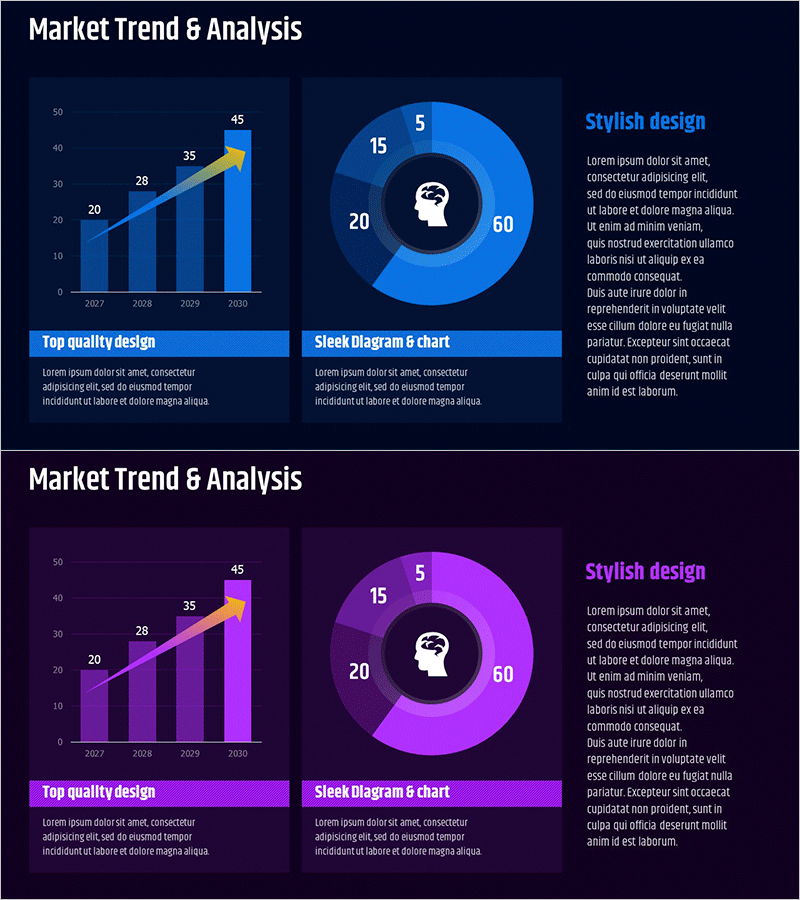
A comprehensive data visualization PowerPoint slide set for market trend analysis featuring a bar chart and donut chart design. The template includes a 4-step bar graph tracking trends from 2007 to 2030 and a 4-segment donut chart displaying proportions of 60, 20, 15, and 5 percent. Set against a dark background with blue or purple gradient accents, the design emphasizes data clarity and visual impact. Ideal for business presentations, quarterly reports, market analysis briefings, and investor pitch decks. The 16:9 widescreen PPTX format allows full customization of colors, values, and text elements for seamless integration into any corporate presentation.
Usage Points
-
Main Usage
This dual-chart design simultaneously displays temporal trends and compositional ratios, making it ideal for comprehensive market analysis presentations. The bar chart emphasizes year-over-year growth patterns while the donut chart illustrates current market composition or customer segmentation. Perfect for executive briefings, investor relations, and strategic planning sessions requiring credible data visualization.
-
How to Use
Customize the bar chart on slide 1 by entering your historical data to show growth trajectories across multiple years. On slide 2, adjust the donut chart segments to represent market share, customer demographics, or revenue distribution. Add legends and descriptive text to enhance audience comprehension, and modify colors to align with corporate branding guidelines for visual consistency.
-
Recommended For
Executive dashboards, quarterly business reviews, market research presentations, investor pitch decks, marketing strategy workshops, and consulting proposals. Particularly valuable for finance, technology, manufacturing, and retail sectors where data-driven decision-making is critical.
-
Slide Structure
Slide 1: Title area + 4-segment bar chart (2007–2030 timeline, values 20→28→35→45) + legend + descriptive text. Slide 2: Title area + 4-segment donut chart (60, 20, 15, 5 percent distribution with center icon) + legend + descriptive text. Both slides feature dark background with blue or purple gradient styling.
Related Products
-

Market Trend Analysis Chart – Effective Data Visualization
#Market and Competitor Analysis #Graph #Market Analysis
-

Market Trend Analysis Diagram – Effective Material for Strategy Development
#Market and Competitor Analysis #Diagram #Graph
-

Chart of Industry Change and Global Market Outlook Analysis
#Market and Competitor Analysis #Graph #Market Analysis
-

Market Demand Analysis PowerPoint Slide – Donut Chart Layout
#Market and Competitor Analysis #Graph #Customer Analysis
