Stock Structure and Issuance History Analysis Table – Efficient Data Visualization
RM0600002_7
- Last Update 02/23/2025
- File Size 2.3MB
- # of Slides 2
- File Format PPTX
- Slide Ratio 16:9
- Color
Keywords
- #Content-Based Slides
- #Design-Based Slides
- #Financial Plans and Performance
- #Diagram
- #Capital Requirements
- #Projected Return on Investment (ROI)
- #Table
- #Standard Table
- #16:9
- #stock structure analysis table PowerPoint
- #issuance history table slide
- #financial data visualization PPT
- #investor pitch deck template
- #stock status table slide
- #how to create financial analysis table in PowerPoint
About the Product
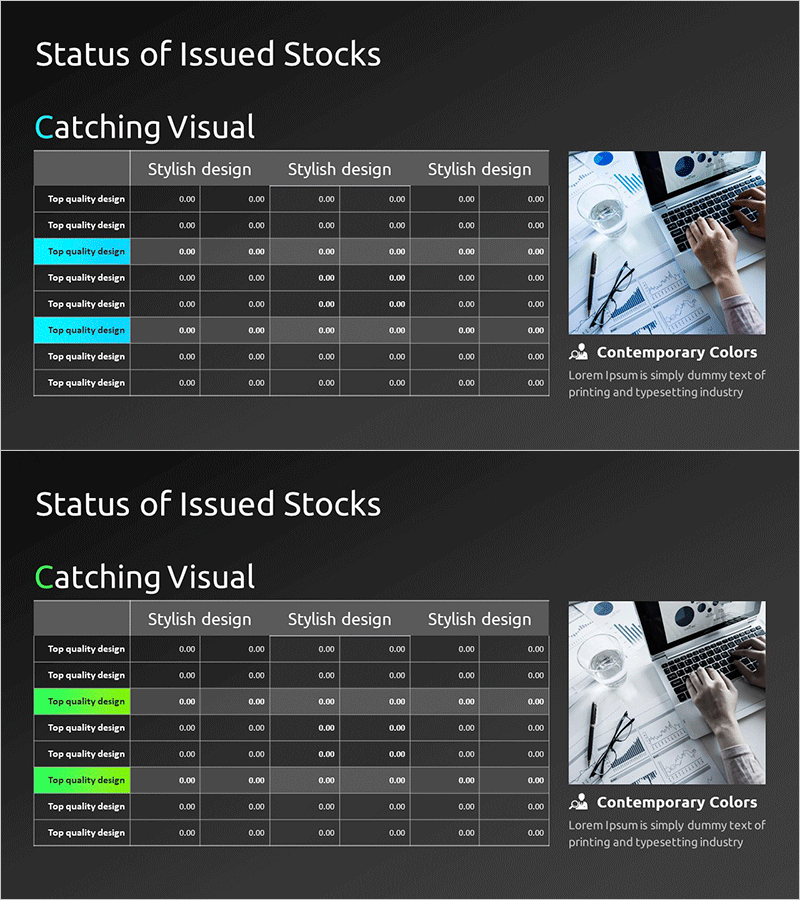
A table-based PowerPoint slide for presenting stock structure and issuance history with clear data organization. This 2-slide presentation template features a dark background with blue and white accent lines, designed for financial analysis, investor pitch decks, and business plan presentations. The row-column structure enables side-by-side comparison of stock status, issuance records, and projected returns. Each cell is fully editable, allowing you to input company-specific data in minutes. Delivered in 16:9 widescreen PPTX format compatible with all presentation environments.
Usage Points
-
Main Usage
Organize multiple financial data points—stock structure, issuance history, projected returns—in a row-column table format for clear investor and stakeholder communication. High-contrast dark background design ensures readability in projector-based presentation environments.
-
How to Use
Insert into the financial section of business plans, capital structure explanations in investor pitch decks, or quarterly earnings reports. Edit cell values and labels to match your company data, then use immediately in presentations without additional formatting.
-
Recommended For
CFOs and finance teams preparing investor presentations, startup founders explaining capital structure in business plans, financial analysts visualizing stock status and equity distribution, corporate treasurers reporting quarterly capital changes.
-
Slide Structure
2-slide deck with table structure: 6 columns (item name, value, ratio, change, forecast, notes) and 8–9 data rows per slide. Header row uses blue background; data rows alternate between dark gray and white for visual clarity and readability.
Related Products
-

Stock Structure and Issuance History Analysis Table – Integrated Financial Data
#Financial Plans and Performance #Diagram #Capital Requirements
-

Stock Issuance Status Analysis Chart – Financial Planning and Performance
#Financial Plans and Performance #Diagram #Capital Requirements
-

Curved Theme Purple Template Diagram – Investment Planning and Performance
#Financial Plans and Performance #Diagram #Capital Requirements
-

Stock Status Analysis Table – A Tool for Financial Planning and Performance
#Financial Plans and Performance #Diagram #Capital Requirements
