Stock Status Analysis Table – A Tool for Financial Planning and Performance
RM0600007_7
- Last Update 02/25/2025
- File Size 1.1MB
- # of Slides 2
- File Format PPTX
- Slide Ratio 16:9
- Color
Keywords
- #Content-Based Slides
- #Design-Based Slides
- #Financial Plans and Performance
- #Diagram
- #Capital Requirements
- #Projected Return on Investment (ROI)
- #Table
- #Standard Table
- #16:9
- #stock status table PowerPoint
- #financial data table slide
- #table template presentation
- #quarterly results analysis slide
- #financial performance chart download
About the Product
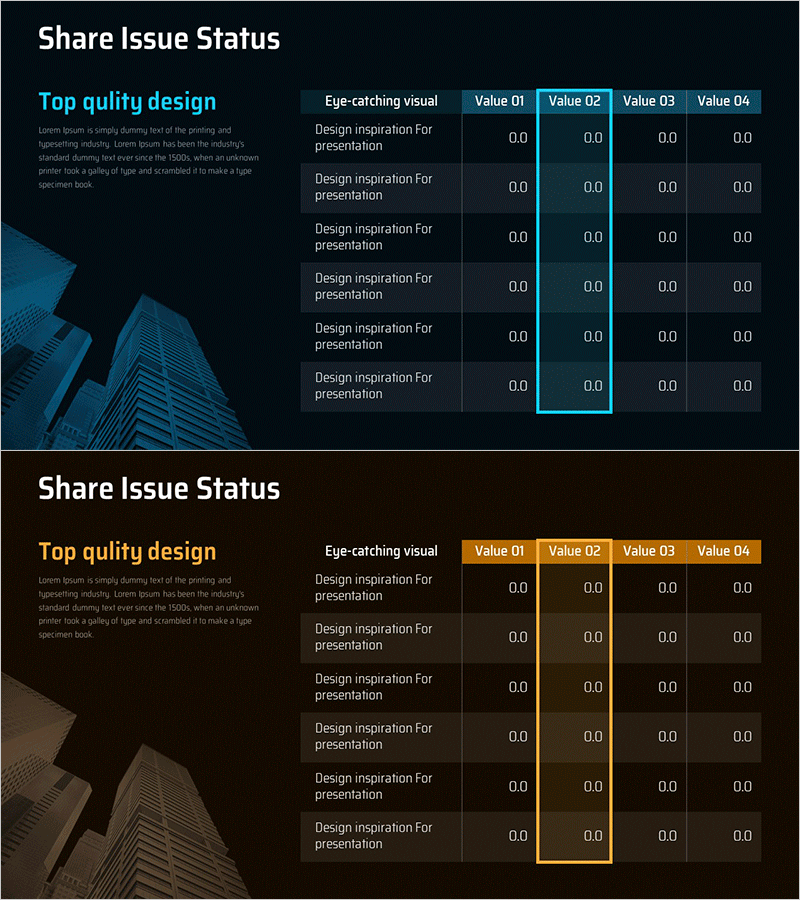
A 6-row, 4-column table PowerPoint slide designed to present financial status and performance metrics clearly. The dark background with cyan accent borders enhances data readability and visual hierarchy. Ideal for displaying stock performance, quarterly results, financial forecasts, and comparative analysis in investor presentations, financial reports, and executive briefings. The 2-slide set provides flexible layout options for different data scenarios and presentation contexts.
Usage Points
-
Main Usage
Present quantitative financial data, stock performance, quarterly results, and comparative metrics in a structured table format to investors, executives, and stakeholders with maximum clarity and impact.
-
How to Use
Input financial figures, stock prices, and performance indicators into each cell. The dark background with cyan borders automatically organizes data sections, allowing immediate use in presentations without additional formatting.
-
Recommended For
Finance professionals, investor relations (IR) specialists, executive report managers, financial analysts, and consultants presenting quarterly earnings, financial status, stock performance, and comparative analysis.
-
Slide Structure
Two-slide set featuring a 6-row, 4-column data table. First slide includes header row with standard layout; second slide offers alternative arrangement. Dark background with cyan borders and white text maximizes contrast for optimal numerical data visibility.
Related Products
-

Curved Theme Purple Template Diagram – Investment Planning and Performance
#Financial Plans and Performance #Diagram #Capital Requirements
-

Stock Structure and Issuance History Analysis Table – Efficient Data Visualization
#Financial Plans and Performance #Diagram #Capital Requirements
-

Stock Structure and Issuance History Analysis Table – Integrated Financial Data
#Financial Plans and Performance #Diagram #Capital Requirements
-

Stock Issuance Status Analysis Chart – Financial Planning and Performance
#Financial Plans and Performance #Diagram #Capital Requirements
