Stock Issuance Status Analysis Chart – Financial Planning and Performance
RM0600003_7
- Last Update 02/23/2025
- File Size 0.3MB
- # of Slides 2
- File Format PPTX
- Slide Ratio 16:9
- Color
Keywords
- #Content-Based Slides
- #Design-Based Slides
- #Financial Plans and Performance
- #Diagram
- #Capital Requirements
- #Projected Return on Investment (ROI)
- #Table
- #Standard Table
- #16:9
- #table PowerPoint slide
- #financial data presentation
- #stock issuance chart
- #data table template
- #financial analysis slides
- #how to create financial table in PowerPoint
About the Product
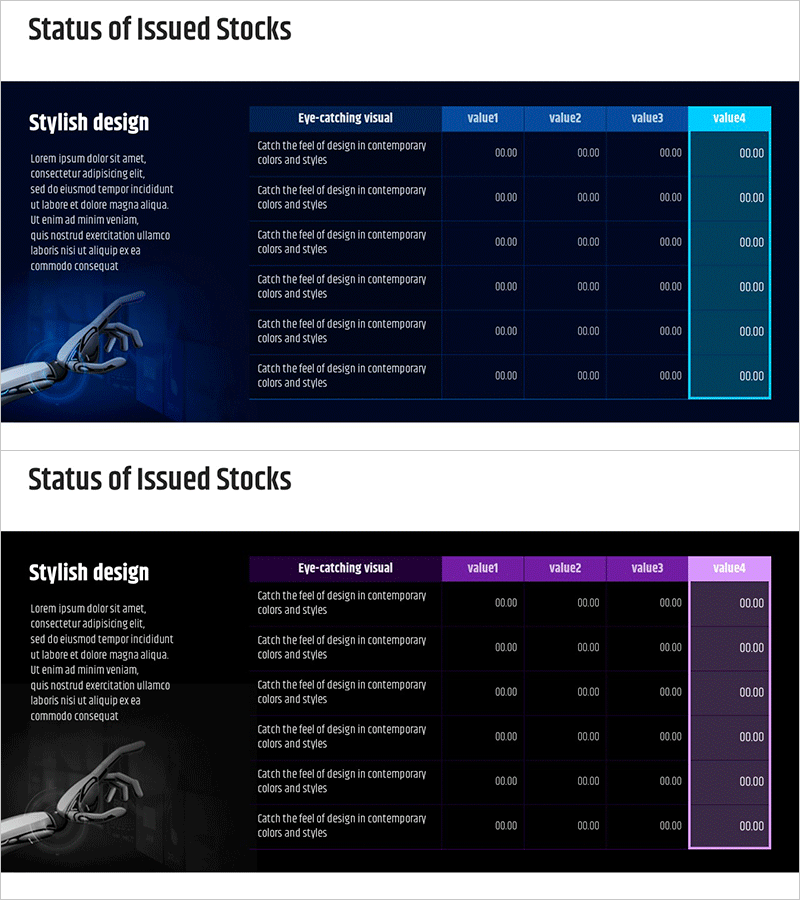
A table-based PowerPoint slide for systematically analyzing stock issuance status and financial performance. Featuring a dark navy background with bright blue and cyan accent colors across 2 slides, this template provides a 6-row by 4-column data entry structure. Each cell accommodates numerical data in 00.00 format, while an illustrative hand graphic on the left reinforces business credibility. Instantly applicable to financial presentations including financial planning, performance analysis, and investor reports.
Usage Points
-
Main Usage
Clearly organize and compare financial data and stock issuance status in tabular format. The 6-row by 4-column structure enables simultaneous presentation of multiple numerical data points, conveying financial status intuitively to investors and stakeholders.
-
How to Use
Input financial figures, stock issuance volumes, pricing information, and other metrics into each cell. Deploy in business plans, investment pitch decks, quarterly performance reports, and shareholder meeting materials within the financial overview section to enhance data credibility. The 2-slide format accommodates multiple scenarios or comparative analysis.
-
Recommended For
Ideal for CFOs, finance managers, investor relations specialists, and executives presenting financial status. Recommended for startup fundraising pitches, public company quarterly earnings presentations, M&A negotiation materials, and bank loan application documents requiring credible data visualization.
-
Slide Structure
Organized as a 6-row by 4-column table. The header row displays column titles such as 'Item', 'value1', 'value2', 'value3', and 'value4', with 5 data entry rows below. Dark navy background with bright blue headers and cyan accent cells create visual hierarchy, while the left-side illustration area balances the overall layout composition.
Related Products
-

Stock Structure and Issuance History Analysis Table – Efficient Data Visualization
#Financial Plans and Performance #Diagram #Capital Requirements
-

Stock Status Analysis Table – A Tool for Financial Planning and Performance
#Financial Plans and Performance #Diagram #Capital Requirements
-

Curved Theme Purple Template Diagram – Investment Planning and Performance
#Financial Plans and Performance #Diagram #Capital Requirements
-

Stock Structure and Issuance History Analysis Table – Integrated Financial Data
#Financial Plans and Performance #Diagram #Capital Requirements
