Business Future Outlook Analysis Chart
RM0600002_17
- Last Update 02/23/2025
- File Size 1.1MB
- # of Slides 2
- File Format PPTX
- Slide Ratio 16:9
- Color
Keywords
About the Product
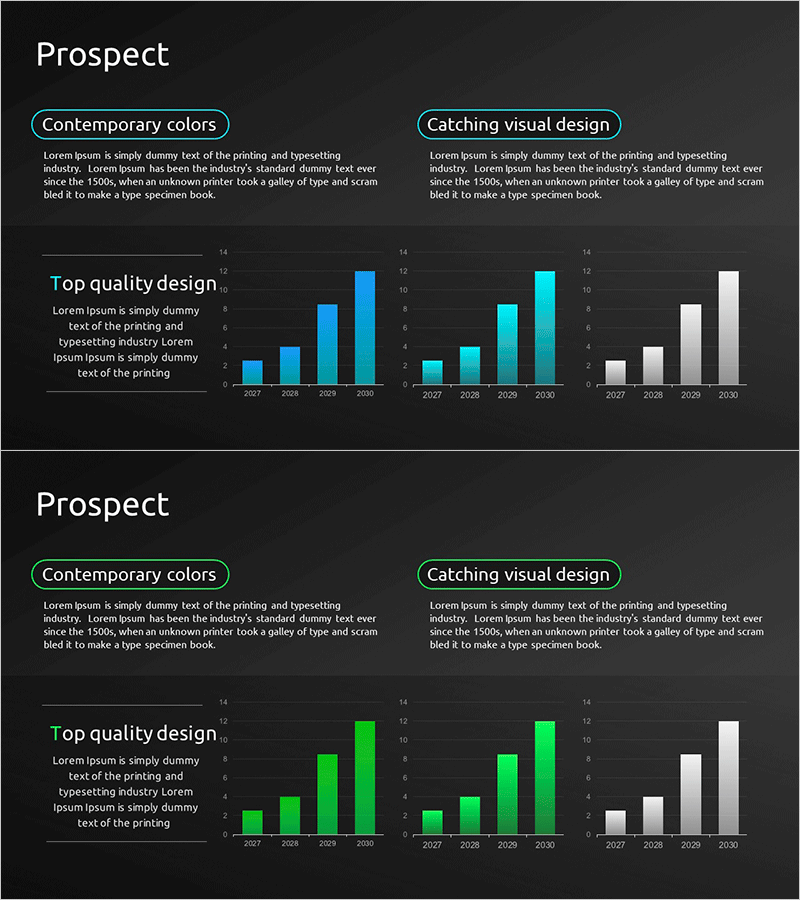
A vertical bar chart PowerPoint slide for analyzing business future outlook and market trends. Displayed on a dark background with three data series in blue, cyan, and gray tones, representing four-year projections from 2027 to 2030. Each slide features two design themes: 'Contemporary colors' and 'Catching visual design,' with a text area on the left for analytical commentary. The layout combines data visualization with narrative space, making it ideal for business plans, market analysis reports, and investor presentations. Fully editable and ready to customize with your own data and insights.
Usage Points
-
Main Usage
Visualize four-year business market projections and competitive performance changes using vertical bar charts. The three-series format enables simultaneous comparison of multiple metrics such as revenue, market share, and competitive benchmarking to support strategic decision-making.
-
How to Use
Deploy in the market analysis section of business plans, growth validation slides in investor pitch decks, and strategic planning sections of executive reports. Edit the left text area with analytical conclusions and update chart values with actual business data before presenting.
-
Recommended For
Business strategists, marketing planners, financial analysts, and executives presenting market outlook and business growth potential. Particularly effective for multi-year comparative analysis and investor communications requiring data-driven narratives.
-
Slide Structure
Two-slide deck. Each slide contains a title area at top, left-side text box (accommodates 4 lines of commentary), and right-side vertical bar chart with 3 data series across 4 years (2027–2030), Y-axis range 0–14. Dark background with neon cyan, blue, and gray accent colors emphasizes data points.
Related Products
-

Global Market Future Outlook Chart – Forward-Looking Business Analysis
#Market and Competitor Analysis #Graph #Market Status
-

Industrial Market Outlook Analysis Graph – Market Status and Growth Potential
#Market and Competitor Analysis #Graph #Market Status
-

IT Industry Market Outlook Analysis Graph – Current Market Status and Future Prospects
#Market and Competitor Analysis #Diagram #Graph
-

Future Outlook Analysis Graph – Market Status and Forecast
#Market and Competitor Analysis #Graph #Market Status
