Medical Services Characteristics Connection Diagram
RM0600003_17
- Last Update 02/23/2025
- File Size 0.3MB
- # of Slides 2
- File Format PPTX
- Slide Ratio 16:9
- Color
Keywords
- #Content-Based Slides
- #Design-Based Slides
- #Market and Competitor Analysis
- #Graph
- #Market Status
- #Future Outlook
- #Horizontal Bar
- #Horizontal Bar Chart
- #16:9
- #combination chart PowerPoint
- #bar graph slide template
- #line chart diagram
- #healthcare market analysis slide
- #data visualization PowerPoint
- #trend comparison template download
About the Product
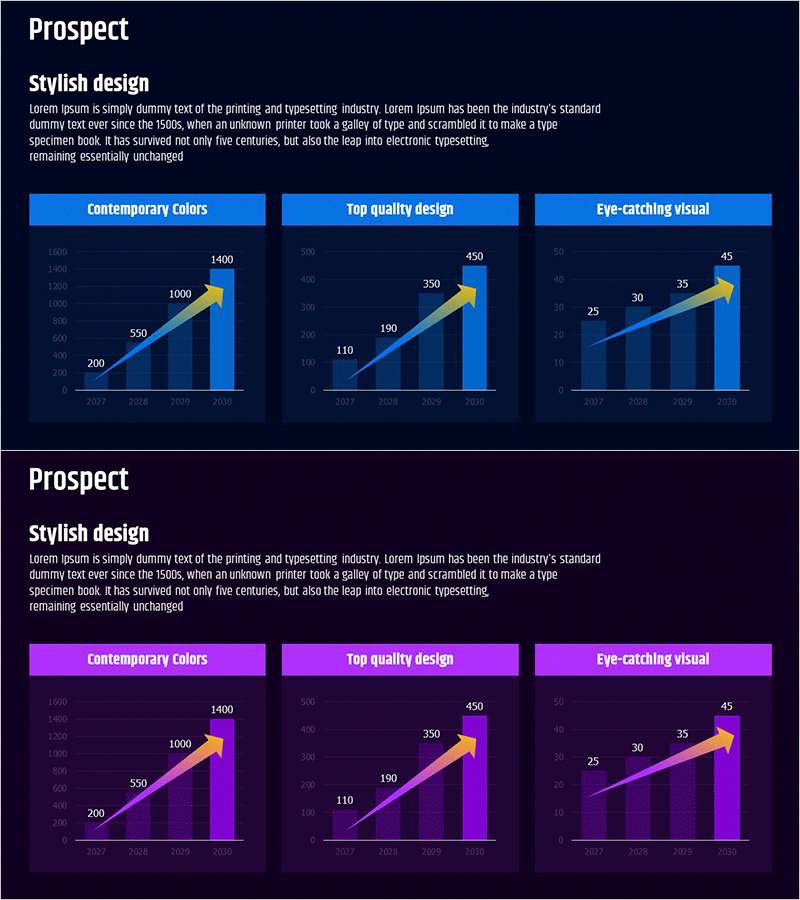
A combination bar and line chart PowerPoint slide optimized for healthcare market analysis and competitive benchmarking. Composed of 3 sections, each combining horizontal bar graphs with line graphs to simultaneously display 4 data series. Applied on a dark navy background with blue and yellow accent colors to clearly visualize data points. Enables intuitive year-over-year trend comparison from 2007 to 2030, ready for immediate use in presentations, reports, and strategic proposals. Provided in 16:9 widescreen PPTX format with 2 slides.
Usage Points
-
Main Usage
Simultaneously express multiple healthcare metrics such as market size, growth rate, and competitor market share using a combination chart format. Bar graphs display absolute values while line graphs emphasize trends, clearly communicating data change patterns.
-
How to Use
Apply in the market analysis section of healthcare industry presentations, reports, and strategic proposals. Replace each section title (Contemporary Colors / Top quality design / Eye-catching visual) with your own analysis categories, then edit bar and line values with actual data. Maintain the color scheme or adjust accent colors as needed.
-
Recommended For
Ideal for healthcare and medical device company executives, marketing teams, and strategy teams presenting market conditions, competitive analysis, and growth forecasts. Suitable for investor pitch decks, business plans, quarterly performance reports, and consulting proposals requiring multi-series data comparison.
-
Slide Structure
2-slide deck with 3 sections per slide. Each section features a horizontal bar graph (4 data points) combined with a line graph (1 trend line). Dark navy background with blue bars, yellow accent arrows, and white text for contrast. 16:9 widescreen format, PPTX file type.
Related Products
-

IT Industry Market Outlook Analysis Graph – Current Market Status and Future Prospects
#Market and Competitor Analysis #Diagram #Graph
-

Global Market Future Outlook Chart – Forward-Looking Business Analysis
#Market and Competitor Analysis #Graph #Market Status
-

Business Future Outlook Analysis Chart
#Market and Competitor Analysis #Graph #Market Status
-

Industrial Market Outlook Analysis Graph – Market Status and Growth Potential
#Market and Competitor Analysis #Graph #Market Status
