IT Industry Market Outlook Analysis Graph – Current Market Status and Future Prospects
RM0500007_10
- Last Update 02/21/2025
- File Size 3.9MB
- # of Slides 2
- File Format PPTX
- Slide Ratio 16:9
- Color
Keywords
- #Content-Based Slides
- #Design-Based Slides
- #Market and Competitor Analysis
- #Diagram
- #Graph
- #Market Status
- #Future Outlook
- #Cluster
- #Horizontal Bar
- #Closed Cluster Diagram
- #Horizontal Bar Chart
- #16:9
- #horizontal bar chart PowerPoint
- #market outlook analysis slide
- #time series data visualization
- #bar graph template
- #business chart PPT
About the Product
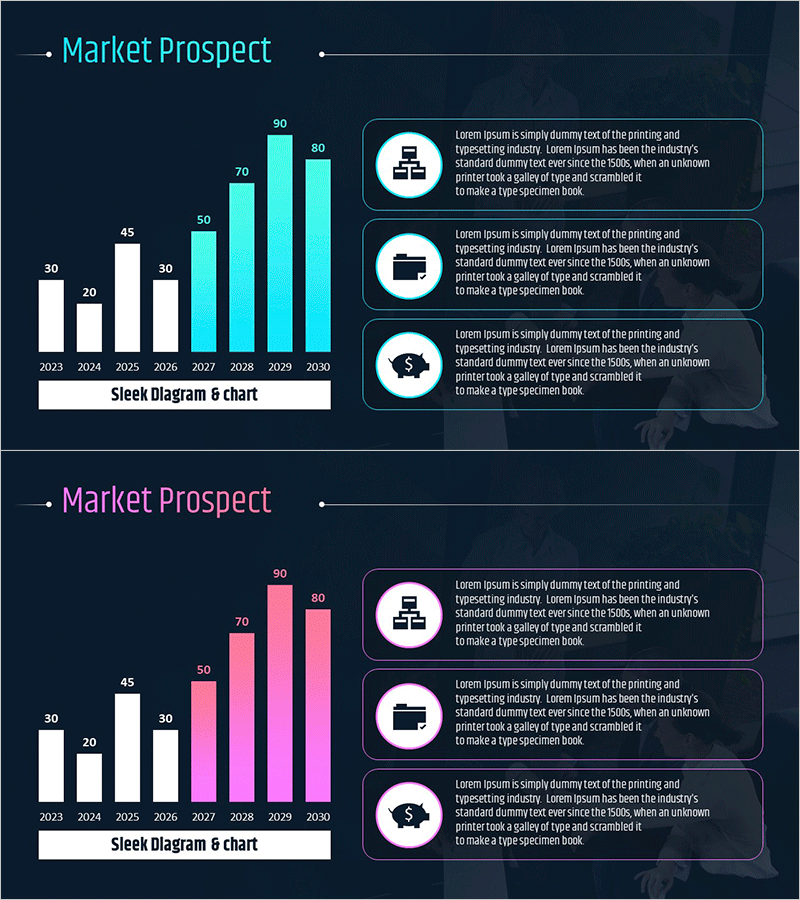
A horizontal bar chart PowerPoint slide visualizing IT industry market prospects from 2023 to 2030. This presentation template displays eight years of market size data with clear numerical labels, complemented by three icon-based descriptions on the right side. The consistent cyan color palette ensures data credibility and provides strong contrast against the dark background. The slide is ready to use for business presentations including market analysis, competitive benchmarking, and future outlook reports.
Usage Points
-
Main Usage
Visualize year-over-year market size changes, growth trends, and competitive comparisons using horizontal bar charts for market outlook presentations. Clearly labeled numerical values enable accurate data communication and trend analysis.
-
How to Use
Place this slide in the market analysis section of business presentations, industry reports, investor briefings, and executive summaries. Enhance data interpretation by adding key insights or strategic points to the icon text areas on the right side.
-
Recommended For
Marketing professionals, business planning teams, executives, and investor presentations. Applicable across IT, finance, manufacturing, retail, and other industries for market size comparisons and growth rate analysis.
-
Slide Structure
Left side features a horizontal bar chart with eight years of data (2023–2030) represented by cyan bars with numerical labels at the end of each bar. Right side contains three circular icons with text description areas arranged vertically for adding interpretive information.
Related Products
-

Global Market Future Outlook Chart – Forward-Looking Business Analysis
#Market and Competitor Analysis #Graph #Market Status
-

Industrial Market Outlook Analysis Graph – Market Status and Growth Potential
#Market and Competitor Analysis #Graph #Market Status
-

Business Future Outlook Analysis Chart
#Market and Competitor Analysis #Graph #Market Status
-

Medical Services Characteristics Connection Diagram
#Market and Competitor Analysis #Graph #Market Status
