Last Year's Sales Comparison Analysis Table – Visually Representing Financial Performance
RM0100017_31
- Last Update 01/30/2025
- File Size 0.2MB
- # of Slides 2
- File Format PPTX
- Slide Ratio 16:9
- Color
Keywords
- #Content-Based Slides
- #Design-Based Slides
- #Financial Plans and Performance
- #Diagram
- #Balance Sheet
- #Income Statement
- #Table
- #16:9
- #balance sheet PowerPoint slide
- #financial comparison analysis template
- #sales analysis table slide
- #how to create a financial report in PowerPoint
- #income statement PPT design
About the Product
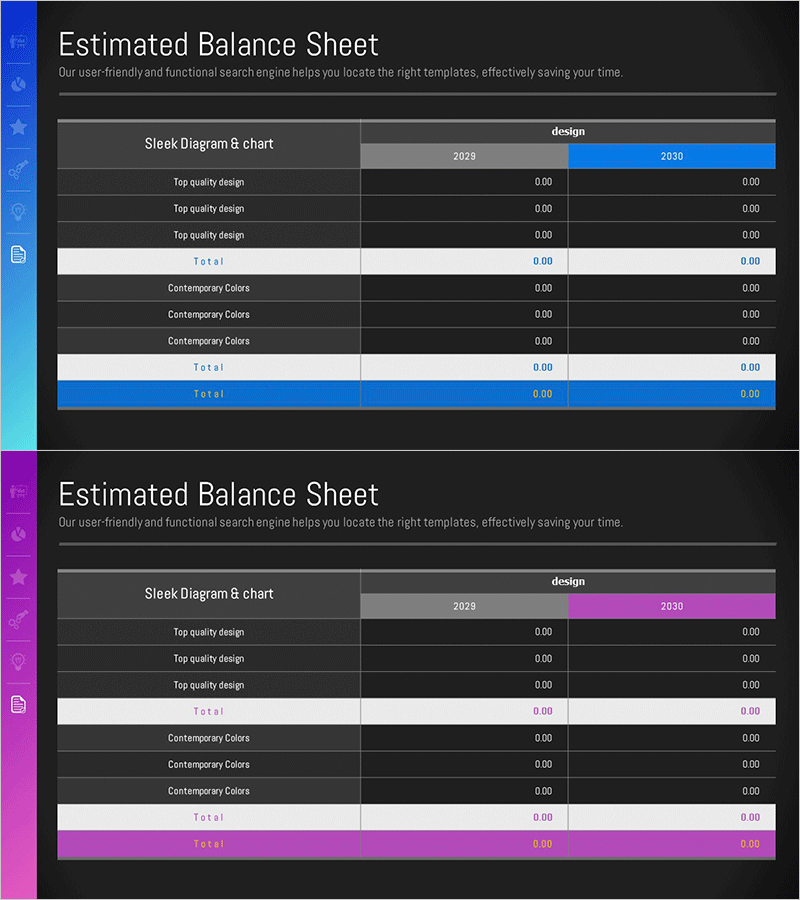
A 2-slide PowerPoint presentation designed for clear financial performance comparison and analysis. The slides feature a dark background with white typography and blue and pink accent colors, arranged in a table layout that enables side-by-side comparison of 2023 and 2030 data. Each slide uses row-based item categorization with clearly marked numerical input areas, maximizing readability for financial data visualization. Ready to use immediately in investor presentations, IR materials, executive reports, and financial performance decks.
Usage Points
-
Main Usage
Compares annual financial performance across two fiscal years using a structured table format. Displays key financial metrics including income statements, balance sheet items, and revenue figures with numerical data, enabling clear communication of financial status to executives and investors.
-
How to Use
Enter item names (such as revenue, expenses, profit) in the left column, then input corresponding numerical values in the 2023 and 2030 columns. The total row is either auto-calculated or manually entered with emphasis formatting to highlight key metrics. Color accents (blue and pink) visually distinguish specific line items for emphasis.
-
Recommended For
CFOs and finance professionals presenting financial status in executive meetings, investor IR presentations comparing year-over-year performance, business plans projecting financial forecasts, and quarterly earnings reports requiring comparative financial analysis.
-
Slide Structure
Two-slide deck with each slide containing one title area and one table area. The table uses a three-column structure: left column for item names, center column for 2023 data, and right column for 2030 data. Rows include 3-4 line items, one subtotal row, and one grand total row, clearly expressing financial data hierarchy.
Related Products
-

Visualizing Financial Status with Balance Sheet Table
#Financial Plans and Performance #Diagram #Balance Sheet
-

Asset, Capital Structure Analysis Table - An Effective Tool for Financial Planning
#Financial Plans and Performance #Diagram #Balance Sheet
-

Emphasizing Key Row in Table – Essential Tool for Financial Management
#Financial Plans and Performance #Diagram #Balance Sheet
-

Organizing Insights for Clarity – Emphasizing Financial Planning and Performance
#Financial Plans and Performance #Diagram #Balance Sheet
