Geometry Pattern Wide Table PPT Template for Financial Planning and Performance
RJ0200034_18
- Last Update 04/07/2025
- File Size 0.1MB
- # of Slides 2
- File Format PPTX
- Slide Ratio 16:9
- Color
Keywords
- #Content-Based Slides
- #Design-Based Slides
- #Financial Plans and Performance
- #Diagram
- #Balance Sheet
- #Income Statement
- #Table
- #Standard Table
- #16:9
- #financial data table PowerPoint
- #comparison table slide template
- #6-item data table
- #financial planning presentation
- #performance analysis slide
- #how to create data table in PowerPoint
About the Product
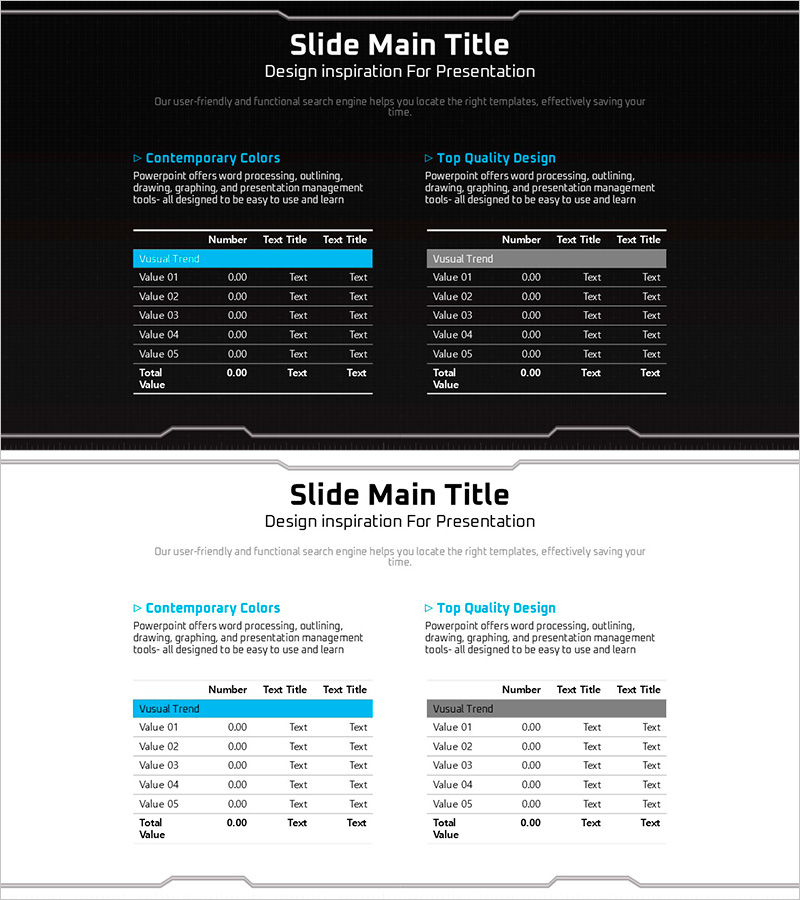
A 2-slide PowerPoint presentation featuring side-by-side table layouts for comparing financial planning and performance metrics. Each slide displays two symmetrical tables with headers in blue geometric pattern design, containing 6 data rows (Value 01–05 plus Total Value) across three columns (Number, Test Title, Test Title). The white data area contrasts with the blue patterned header, ensuring clear readability for numerical information. Designed in 16:9 widescreen format, this template is ready to use for financial reports, quarterly performance reviews, budget analysis presentations, and business outcome summaries.
Usage Points
-
Main Usage
This slide enables side-by-side comparison of financial metrics, budget items, and performance indicators using a symmetrical table structure. Input six data points in each section to display current plans versus actual results, or compare two scenarios simultaneously. The blue geometric header reinforces professionalism while the clear data layout supports executive decision-making.
-
How to Use
Apply this template in financial reports, quarterly earnings presentations, budget review meetings, and business planning sessions. Edit the 'Number' column with your figures and customize 'Test Title' headers to match your data categories. The 2-slide format allows you to present multiple data comparisons in sequence.
-
Recommended For
CFOs, financial analysts, executives, business planning teams, and consultants presenting financial analysis to leadership, investors, and boards. Ideal for budget-versus-actual analysis, year-over-year financial comparisons, and departmental performance evaluations.
-
Slide Structure
Each slide contains a title area and two independent tables arranged symmetrically. Each table features a blue geometric header row (Number, Test Title, Test Title) with six data rows below (Value 01–05 and Total Value). The side-by-side arrangement enables direct comparison of two datasets, while the geometric pattern elements provide visual cohesion throughout the presentation.
Related Products
-

Organizing Insights for Clarity – Emphasizing Financial Planning and Performance
#Financial Plans and Performance #Diagram #Balance Sheet
-

Comparative Analysis Table Chart for Financial Performance – Trust and Expertise
#Financial Plans and Performance #Diagram #Balance Sheet
-

Estimated Balance Sheet Table – Essential for Financial Performance
#Financial Plans and Performance #Diagram #Balance Sheet
-

Table of Contents for Profit Achievement – Visualizing Financial Plans
#Financial Plans and Performance #Diagram #Balance Sheet
