Regional Demand Survey Graph – Key to Market Analysis
RJ0900028_8
- Last Update 08/24/2025
- File Size 0.3MB
- # of Slides 2
- File Format PPTX
- Slide Ratio 16:9
- Color
Keywords
- #Content-Based Slides
- #Design-Based Slides
- #Market and Competitor Analysis
- #Financial Plans and Performance
- #Graph
- #Other
- #Market Analysis
- #Sales and Revenue
- #Circles
- #Doughnut Chart
- #Map
- #16:9
- #Asia map PowerPoint slide
- #regional demand analysis template
- #donut chart slide design
- #market analysis presentation
- #how to create regional comparison in PowerPoint
About the Product
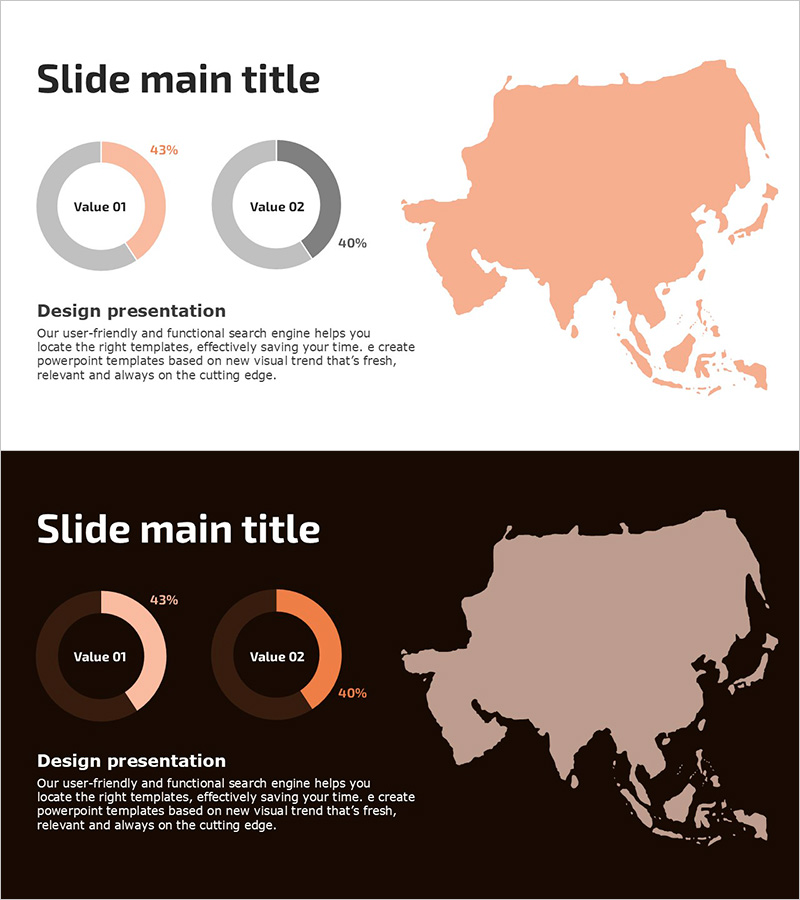
A 2-slide PowerPoint presentation visualizing market demand across Asia-Pacific regions. Features dual donut charts displaying Value 01 (43%) and Value 02 (40%) side-by-side, paired with a coral-colored Asia map showing regional distribution. Includes both light and dark background versions for flexible presentation environments. Ideal for market analysis reports, regional strategy presentations, and business expansion briefings. Ready-to-use slide template in 16:9 widescreen format.
Usage Points
-
Main Usage
Simultaneously display regional market demand ratios using donut charts and geographic mapping to communicate key analytical insights. Enables quick comparison of two metrics while showing geographic distribution across Asia-Pacific.
-
How to Use
Deploy in market analysis sections of business reports, regional strategy presentations, and expansion planning briefings. Use light background for standard conference rooms and dark background for dimly-lit venues or digital displays.
-
Recommended For
Marketing professionals, market analysts, sales strategy teams, and executives preparing regional performance reports. Suitable for international business presentations, distribution strategy discussions, and geographic expansion planning.
-
Slide Structure
Slide 1: Light background with title, two donut charts (43% and 40% values), coral Asia map, and descriptive text. Slide 2: Dark background with identical layout for enhanced contrast. 16:9 widescreen format, PPTX file type, fully editable.
Related Products
-

Idea Presentation Template Wide – Market Analysis and Visualization
#Market and Competitor Analysis #Graph #Other
-

Infographic Design Wide Template Map&Table
#Market and Competitor Analysis #Financial Plans and Performance #Diagram
-

Horizontal Bar Chart Visualizing Market Sales Status
#Market and Competitor Analysis #Financial Plans and Performance #Graph
-

Global Market Analysis Chart – Market Trends and Data Visualization
#Company Introduction #Market and Competitor Analysis #Graph
