Shareholder Status Analysis with Pie Charts and Graphs
RM0300002_7
- Last Update 02/07/2025
- File Size 4.3MB
- # of Slides 2
- File Format PPTX
- Slide Ratio 16:9
- Color
Keywords
- #Content-Based Slides
- #Design-Based Slides
- #Company Introduction
- #Market and Competitor Analysis
- #Diagram
- #Graph
- #Shareholder Structure
- #Market Analysis
- #Table
- #Circles
- #Standard Table
- #Doughnut Chart
- #16:9
- #donut pie chart PowerPoint
- #pie chart slide template
- #shareholder analysis presentation
- #ratio visualization slide
- #business data chart PPT
- #investor presentation template
About the Product
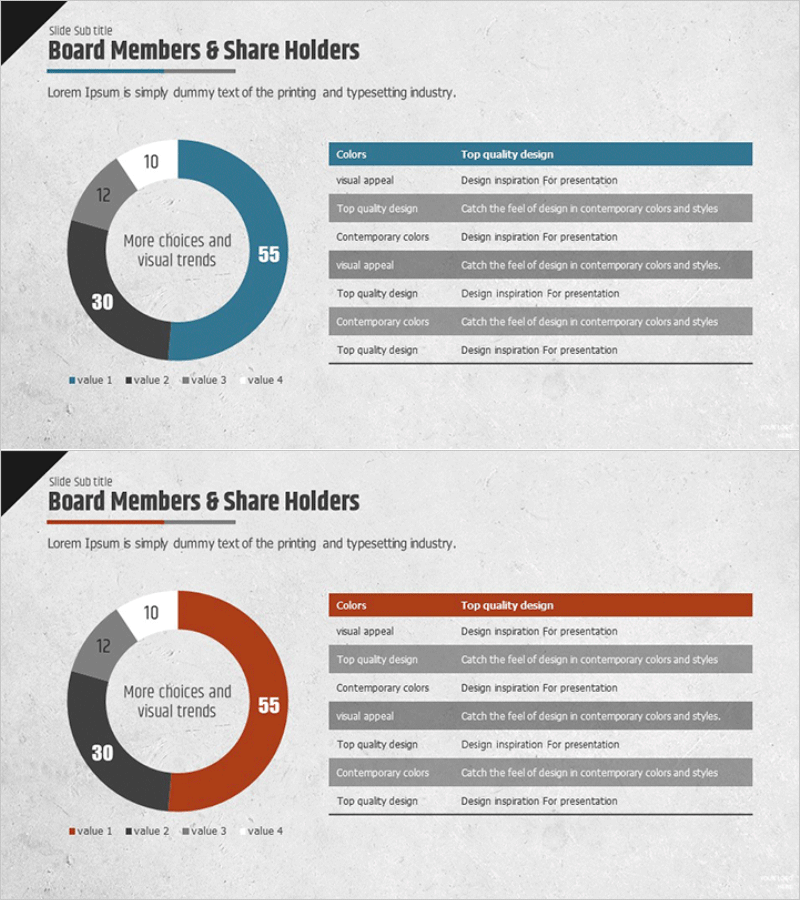
A 2-slide PowerPoint presentation featuring donut-shaped pie charts designed for shareholder status analysis and composition visualization. The 4-segment donut chart displays stakeholder distribution ratios with a prominent central data point, complemented by a detailed information table on the right side. Two color options—blue and red accent schemes—provide flexibility for corporate branding. Each slide combines quantitative data visualization with qualitative context, making it ideal for investor presentations, board meetings, quarterly reports, and executive briefings where stakeholder composition needs clear visual communication.
Usage Points
-
Main Usage
Effectively communicates part-to-whole relationships such as shareholder composition, market share distribution, and asset allocation. The donut center highlights key metrics while the accompanying table provides detailed breakdowns, enabling audiences to grasp both overview and specifics simultaneously.
-
How to Use
Deploy in investor relations presentations, shareholder meetings, board reports, quarterly earnings calls, and executive strategy sessions. Select the blue or red color variant matching your corporate identity, then populate the chart segments and table rows with your specific data.
-
Recommended For
CFOs, financial analysts, investor relations (IR) professionals, board members, management consultants, and business strategists who present quantitative data and drive decision-making. Particularly valuable when explaining stakeholder structures, market positioning, or capital allocation.
-
Slide Structure
Two-slide set with left-aligned 4-segment donut pie chart (center displays key percentage like 55%), right-aligned 6-row information table (Colors, Top quality design, Contemporary colors categories). Available in blue and red color schemes, formatted in 16:9 widescreen aspect ratio.
Related Products
-

Shareholder Status Survey Donut Graph – Optimized for Market Analysis
#Company Introduction #Market and Competitor Analysis #Diagram
-

Status Analysis Donut Chart – Shareholder Status Analysis
#Company Introduction #Market and Competitor Analysis #Diagram
-

Shareholder Status Detailed Analysis Pie Chart & Table – Impactful Data Visualization
#Company Introduction #Market and Competitor Analysis #Diagram
-

Shareholder Status Analysis Donut Chart – Insights and Analysis
#Company Introduction #Market and Competitor Analysis #Diagram
