Visualizing Board Members and Shareholders with a Sleek Diagram
RM0300015_7
- Last Update 09/11/2025
- File Size 2.4MB
- # of Slides 2
- File Format PPTX
- Slide Ratio 16:9
- Color
Keywords
- #Content-Based Slides
- #Design-Based Slides
- #Company Introduction
- #Market and Competitor Analysis
- #Diagram
- #Graph
- #Shareholder Structure
- #Market Analysis
- #Table
- #Circles
- #Standard Table
- #Doughnut Chart
- #16:9
- #donut chart PowerPoint
- #pie chart slide template
- #ratio visualization diagram
- #data visualization PPT
- #how to create donut chart in PowerPoint
About the Product
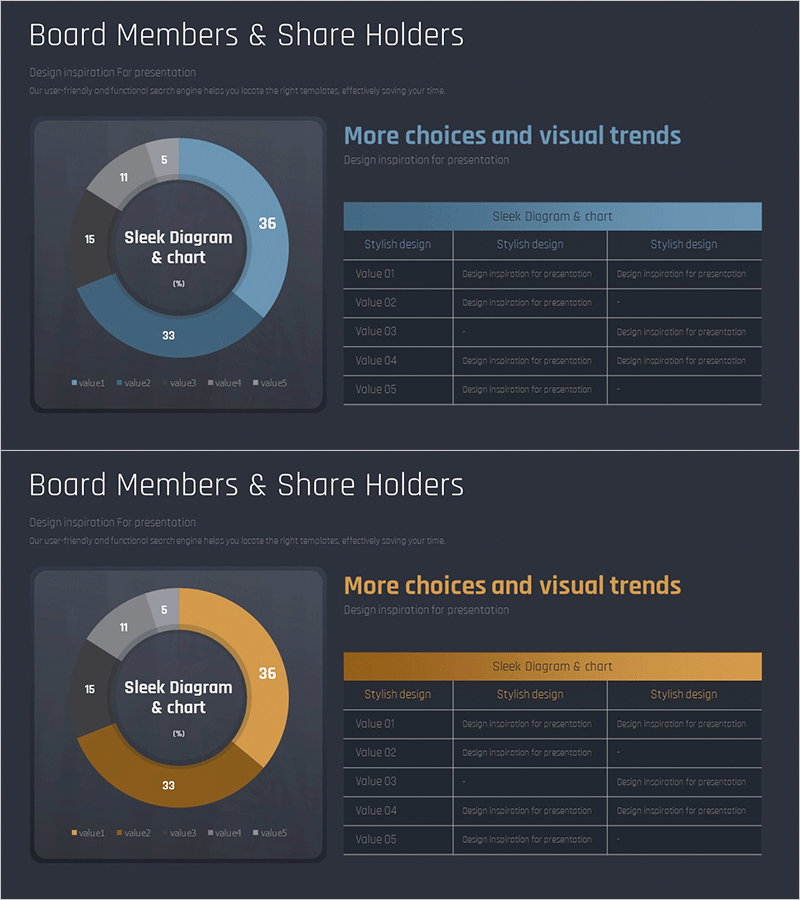
A donut chart PowerPoint slide for visualizing board members and shareholder composition. The design features a central circular area for the main title and an outer donut ring divided into 5 segments to express each item's proportion intuitively. Two color versions are provided: blue and gold palettes, with clear numerical labels on each segment. An accompanying table slide presents detailed information for each item in an organized format. The 2-slide set is in 16:9 widescreen ratio and ready for immediate editing.
Usage Points
-
Main Usage
Ideal for expressing the proportion of each item relative to the whole, such as organizational composition, shareholder stakes, budget allocation, and market share. The central circular area emphasizes the main topic while the outer donut segments categorize details, enabling hierarchical information delivery.
-
How to Use
Use in investor presentations, shareholder meetings, executive reports, and organizational overview presentations to visually explain composition status. Double-click each segment's value to edit and adjust colors to match your organization's branding. Supplement with the accompanying table slide for detailed information.
-
Recommended For
CFOs, IR managers, executives, and organizational development professionals explaining shareholder composition, executive team structure, and departmental staffing distribution. Particularly suitable for financial institutions, consulting firms, corporate executive reports, and investor presentations.
-
Slide Structure
Slide 1: Donut chart with central circular area (title placement) and outer ring divided into 5 segments with numerical labels. Slide 2: Same donut chart in alternate color (gold palette) with a 5-row table on the right displaying item names, descriptions, and values.
Related Products
-

Shareholder Status Analysis with Pie Charts and Graphs
#Company Introduction #Market and Competitor Analysis #Diagram
-

Shareholder Status Analysis Donut Chart – Insights and Analysis
#Company Introduction #Market and Competitor Analysis #Diagram
-

Shareholder Status Analysis Donut Pie Chart – Corporate Growth and Competitive Analysis
#Company Introduction #Market and Competitor Analysis #Diagram
-

Shareholder Status Detailed Analysis Pie Chart & Table – Impactful Data Visualization
#Company Introduction #Market and Competitor Analysis #Diagram
