Profit Analysis Table – Visualizing Financial Planning and Performance
RM0600004_22
- Last Update 02/24/2025
- File Size 0.2MB
- # of Slides 2
- File Format PPTX
- Slide Ratio 16:9
- Color
Keywords
About the Product
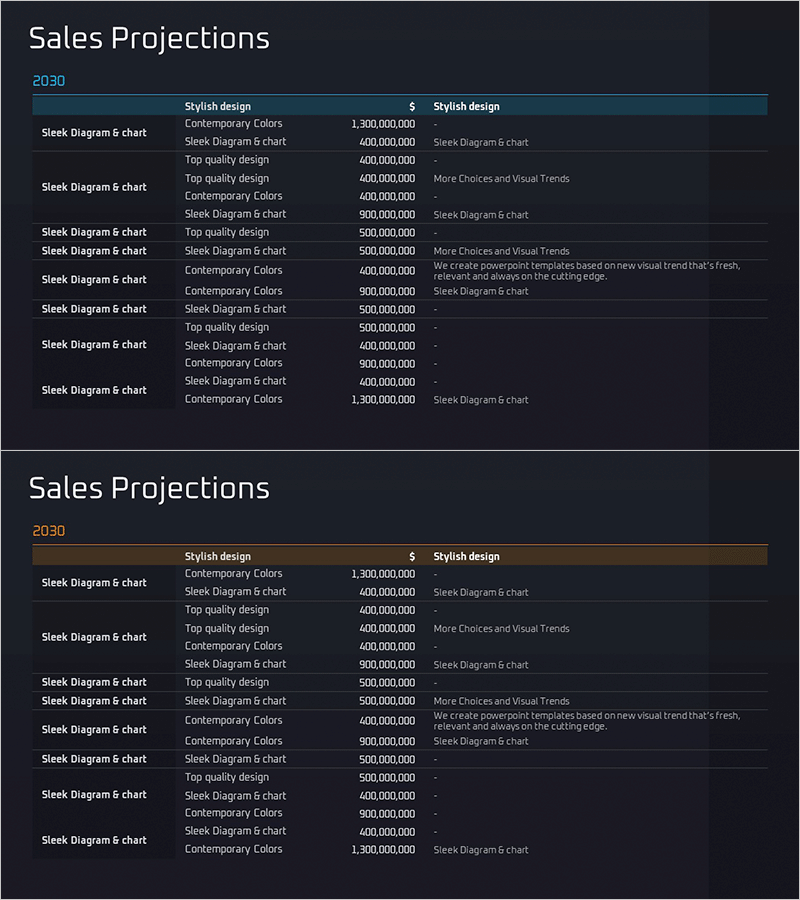
A professional profit analysis table PowerPoint slide that displays financial planning and actual performance side-by-side for clear comparison. Featuring a dark background with teal accent colors, this 2-slide PPTX presentation effectively visualizes revenue data with well-defined rows and columns. Ideal for quarterly earnings reports, investor presentations, and financial performance reviews, this slide deck makes complex financial information highly readable and immediately editable. The structured table layout allows you to organize profit margins, revenue forecasts, actual results, and key financial metrics in a professional manner.
Usage Points
-
Main Usage
Compare budgeted versus actual profit figures and communicate financial performance, revenue trends, and fiscal health to investors, executives, and stakeholders through data-driven visualization.
-
How to Use
Input quarterly or annual revenue data, budget-to-actual comparisons, and departmental profit figures into the structured table rows and columns. Use teal accent colors to highlight key metrics, growth rates, or critical financial indicators.
-
Recommended For
CFOs, financial analysts, and business executives presenting quarterly earnings, investor relations meetings, and financial audit reports. Also suitable for consulting firms delivering financial analysis reports and financial institutions explaining product performance.
-
Slide Structure
Two-slide layout with title area and multi-row, multi-column table sections. Table cells accommodate numerical data, percentages, currency values, and other financial metrics. Header rows and data rows are clearly differentiated for easy reading and data entry.
Related Products
-

Production Cost Variance Analysis Chart – Visualizing Financial Performance
#Financial Plans and Performance #Diagram #Graph
-

Business Outlook Analysis Chart – Future Predictions and Planning
#Financial Plans and Performance #Diagram #Graph
-

Sales Outlook Analysis Segmented Graph – Visualizing Financial Performance
#Financial Plans and Performance #Diagram #Graph
-

Selling Cost Analysis Chart – Clearly Illustrating Financial Performance
#Financial Plans and Performance #Diagram #Graph
