Sales and Profit Calculation Graph – Financial Performance at a Glance
RM0600004_12
- Last Update 02/24/2025
- File Size 0.3MB
- # of Slides 2
- File Format PPTX
- Slide Ratio 16:9
- Color
Keywords
- #Content-Based Slides
- #Design-Based Slides
- #Market and Competitor Analysis
- #Financial Plans and Performance
- #Graph
- #Market Analysis
- #Sales and Revenue
- #Horizontal Bar
- #Segmented Horizontal Bar
- #16:9
- #horizontal bar chart PowerPoint
- #sales profit comparison slide
- #financial performance graph
- #quarterly earnings chart
- #stacked bar chart template
About the Product
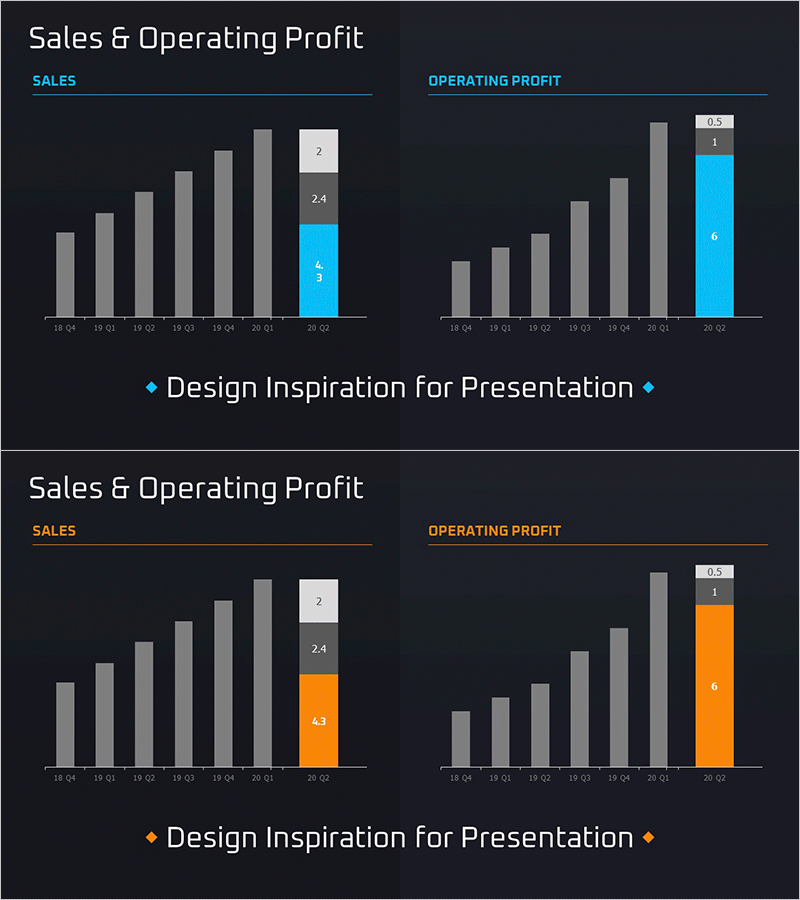
A horizontal bar chart PowerPoint slide that visually compares sales revenue and operating profit across eight quarters (18Q4–20Q2). The stacked bar format displays both total amounts and compositional ratios simultaneously, with the latest quarter highlighted in blue for emphasis. Ideal for financial performance presentations, quarterly earnings reports, investor relations meetings, and executive briefings. The 16:9 widescreen format includes 2 slides with fully editable data labels and values for seamless customization.
Usage Points
-
Main Usage
Compare quarterly sales trends and operating profit simultaneously to communicate financial performance intuitively. The stacked bar format reveals both total revenue and profit composition, enabling stakeholders to assess financial health and profitability at a glance.
-
How to Use
Use in quarterly earnings reports, investor relations (IR) presentations, executive dashboards, business performance announcements, and financial reviews. The blue-highlighted latest quarter draws audience attention to the most recent performance data.
-
Recommended For
Finance teams, CFOs, executives, investor relations managers, and business analysts presenting quarterly financial results. Suitable for public company earnings announcements, internal management meetings, shareholder meetings, and board presentations.
-
Slide Structure
2-slide deck with side-by-side layout: sales chart on the left, operating profit chart on the right. Eight quarters of data displayed as horizontal stacked bars, with the latest quarter (20Q2) highlighted in blue. Numeric labels above each bar segment enable precise value verification and easy data updates.
Related Products
-

Quarterly Furniture Sales Figures Chart – Analysis and Performance
#Market and Competitor Analysis #Financial Plans and Performance #Graph
-

Fantastic Donut Chart – A Slide for Effective Market Analysis
#Market and Competitor Analysis #Financial Plans and Performance #Graph
-

Segmented Gradient Bar Graph – Optimized for Market Analysis
#Market and Competitor Analysis #Graph #Market Analysis
-

Shareholder Status Analysis Data Chart – Insights and Market Analysis
#Company Introduction #Market and Competitor Analysis #Diagram
