Quarterly Furniture Sales Figures Chart – Analysis and Performance
RJ0900028_26
- Last Update 08/24/2025
- File Size 0.9MB
- # of Slides 2
- File Format PPTX
- Slide Ratio 16:9
- Color
Keywords
- #Content-Based Slides
- #Design-Based Slides
- #Market and Competitor Analysis
- #Financial Plans and Performance
- #Graph
- #Market Analysis
- #Sales and Revenue
- #Horizontal Bar
- #Segmented Horizontal Bar
- #16:9
- #horizontal bar chart PowerPoint
- #quarterly sales comparison slide
- #3-series data visualization
- #sales performance template
- #financial analysis PowerPoint slide
- #how to create bar chart in PowerPoint
About the Product
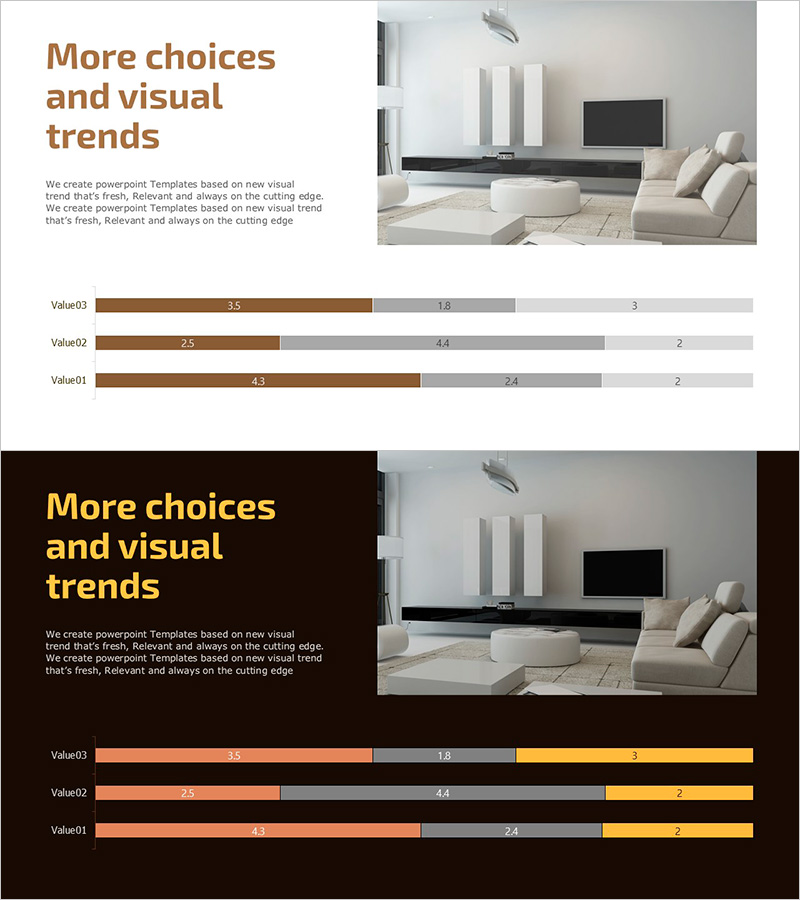
A horizontal bar chart PowerPoint slide comparing quarterly furniture sales across three data series. The slide features brown, gray, and light-tone bars representing sales figures for Value01 through Value03, with a title section on the left and an interior design photograph on the right to contextualize the data. Two versions are provided—one with a light background and one with a dark background—allowing you to match your presentation environment and document tone. Ideal for financial reports, quarterly performance reviews, and market analysis presentations where data-driven insights are essential.
Usage Points
-
Main Usage
Visualize quarterly sales trends and performance across multiple product lines or regions at a glance. The horizontal bar format makes numerical comparisons clear and intuitive, while the accompanying product image reinforces credibility and context for furniture sales reporting.
-
How to Use
Use in financial reports, quarterly earnings presentations, and marketing performance reviews to explain sales data. Replace Value01–03 labels with actual product names or regions, and update bar values with your real sales figures. Customize colors and fonts to match your corporate branding.
-
Recommended For
Sales, marketing, and finance professionals presenting to executives, investors, and stakeholders. Particularly effective for furniture, retail, and interior design industries communicating quarterly results and market performance.
-
Slide Structure
Two-slide set. Each slide contains a title section on the left (brown text 'More choices and visual trends'), a contextual interior photograph on the right, and a three-row horizontal bar chart at the bottom. Bars are color-coded in brown (primary values), gray (secondary values), and light tones (tertiary values), with Value01–03 labels and numerical data displayed for each row.
Related Products
-

Sales and Profit Calculation Graph – Financial Performance at a Glance
#Market and Competitor Analysis #Financial Plans and Performance #Graph
-

VR Market Analysis Bar Graph – Understanding Competitive Landscape
#Market and Competitor Analysis #Graph #Competitor Analysis
-

Space Industry Market Analysis Bar Graph – Providing Strategic Insights
#Market and Competitor Analysis #Graph #Competitor Analysis
-

Fantastic Donut Chart – A Slide for Effective Market Analysis
#Market and Competitor Analysis #Financial Plans and Performance #Graph
