Dividend Analysis Graph - Clarifying Financial Performance
RM0600002_27
- Last Update 02/23/2025
- File Size 1.3MB
- # of Slides 2
- File Format PPTX
- Slide Ratio 16:9
- Color
Keywords
- #Content-Based Slides
- #Design-Based Slides
- #Market and Competitor Analysis
- #Financial Plans and Performance
- #Graph
- #Other
- #Competitor Analysis
- #Projected Return on Investment (ROI)
- #16:9
- #dividend analysis PowerPoint slide
- #dividend graph presentation
- #financial analysis chart slide
- #dividend visualization PPT
- #investment return analysis slide
About the Product
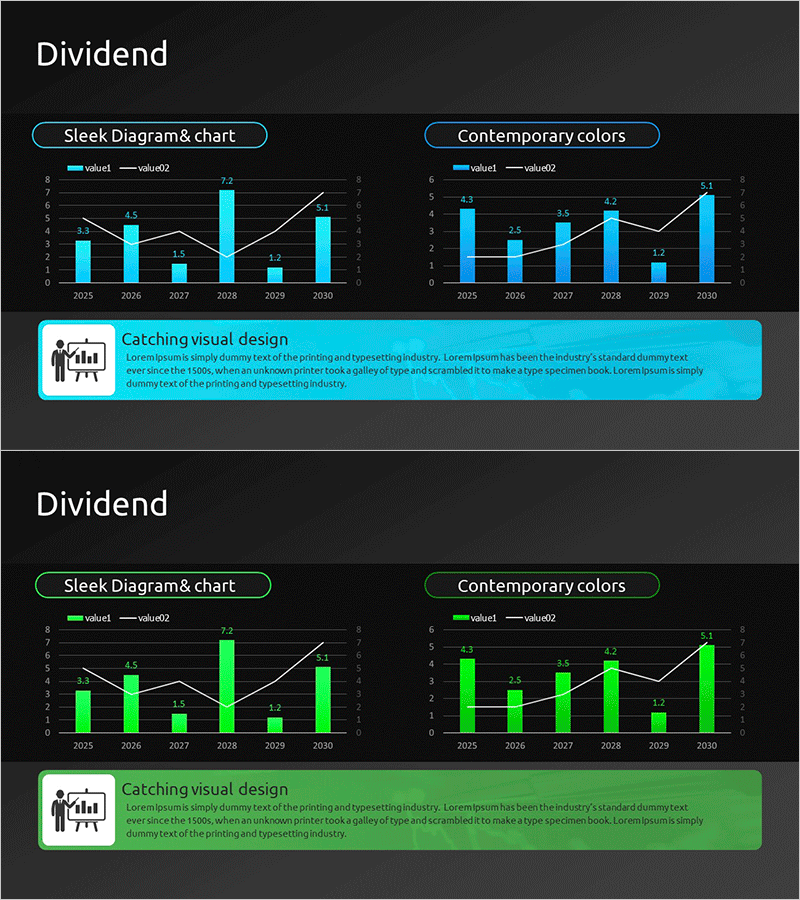
A financial performance visualization PowerPoint slide featuring dividend analysis across two distinct layouts. This 2-slide set presents sleek diagram styling and contemporary color schemes. The left chart combines bar and line graphs to simultaneously display dividend trends and growth rates, while the right chart emphasizes data comparison using vibrant blue tones. Spanning 2025 to 2030, this presentation material enables stakeholders to grasp six years of financial metrics at a glance. Immediately applicable for investor presentations, shareholder meetings, and financial reporting decks.
Usage Points
-
Main Usage
Visualizes dividend trends and growth rates using dual charts to transparently communicate financial performance. Combines bar graphs for absolute values with line graphs for trend changes, providing clear decision-making evidence.
-
How to Use
Deploy in investor presentations, shareholder meetings, quarterly financial reports, and IR materials when explaining dividend policy and performance. Edit slide text and figures with your own data for immediate presentation use.
-
Recommended For
CFOs, financial officers, IR teams, and investor relations managers presenting dividend policy and financial soundness to shareholders and investors. Suitable for quarterly earnings announcements, analyst meetings, and investor briefing materials.
-
Slide Structure
Two-slide composition. First slide features sleek diagram style with bar graph (value1) and line graph (value2) positioned side-by-side. Second slide replicates the same data using contemporary blue-tone color palette for visual variety. Title area at top and descriptive text box at bottom on each slide.
Related Products
-

Dividend Analysis Chart & Dividend Policy – Insights into Market and Performance
#Market and Competitor Analysis #Financial Plans and Performance #Diagram
-

Dividend Yield Comparison Analysis Chart – Visualizing Investment Performance
#Market and Competitor Analysis #Financial Plans and Performance #Graph
-

Sales Activity Comparison Graph - Market and Competitor Analysis
#Market and Competitor Analysis #Financial Plans and Performance #Graph
-

Dividend Yield & Stock Price Growth Rate Analysis Graph
#Market and Competitor Analysis #Financial Plans and Performance #Diagram
