Year-over-Year Comparison Income Statement – Financial Performance Analysis
RM0600003_25
- Last Update 02/23/2025
- File Size 0.3MB
- # of Slides 2
- File Format PPTX
- Slide Ratio 16:9
- Color
Keywords
- #Content-Based Slides
- #Design-Based Slides
- #Financial Plans and Performance
- #Diagram
- #Income Statement
- #Cash Flow Statement
- #Table
- #16:9
- #income statement PowerPoint slide
- #financial table template
- #year-over-year comparison slide
- #financial analysis presentation
- #how to create income statement in PowerPoint
About the Product
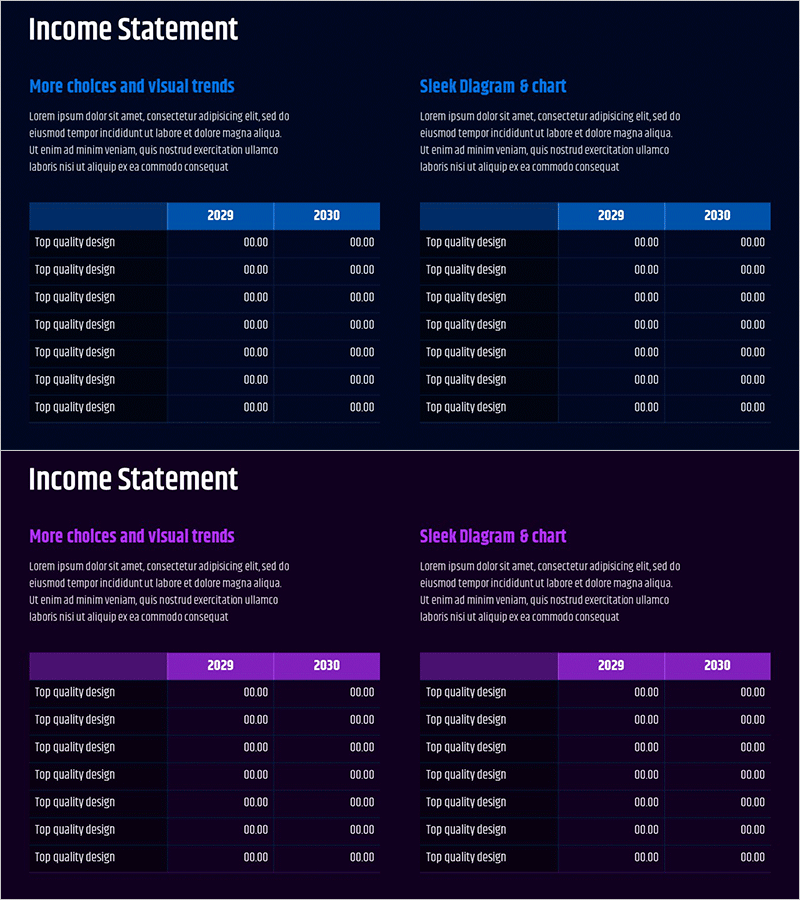
A financial performance analysis PowerPoint slide that clearly presents income statement data across multiple years. This slide features a two-column table layout comparing 2029 and 2030 financial metrics, enabling quick identification of revenue, expense, and profit changes. The dark navy background with bright blue header columns maximizes numerical readability, while the balanced composition of left-side explanation area and right-side chart section delivers both financial data and visual insights simultaneously. Ready to use in investor presentations, annual reports, and financial analysis decks.
Usage Points
-
Main Usage
This slide visualizes financial performance analysis and year-over-year income statement comparison. The two-column table layout displays 2029 and 2030 financial metrics, making revenue, cost structure, and net income changes immediately apparent. Strengthens financial credibility in presentations to investors, employees, and business partners.
-
How to Use
Insert into investor relations materials, quarterly or annual business reports, and financial analysis presentations within the financial section. Add key financial metric interpretations in the left explanation area and input actual figures into the table to customize for your presentation context. Enhance visual impact by adding supplementary graphs in the chart area.
-
Recommended For
Recommended for CFOs, finance managers, executives, and investor relations professionals. Ideal for quarterly earnings presentations, M&A materials, bank loan applications, shareholder meeting reports, and other situations where financial credibility is paramount.
-
Slide Structure
Two-slide layout with the first slide featuring a left explanation area (two text input fields) and right two-column table (2029/2030 columns, seven rows). The second slide maintains the same layout with an added right-side chart area (Sleek Diagram 6 chart) to enhance financial data visualization.
Related Products
-

Vibrant Paint Splash Table Slide – Financial Performance at a Glance
#Financial Plans and Performance #Diagram #Income Statement
-

Income Statement Table by Year
#Financial Plans and Performance #Diagram #Income Statement
-

Activity Time & Calorie Burn Table – Structure for Financial Performance
#Financial Plans and Performance #Diagram #Income Statement
-

Profit and Loss Analysis Table Chart – Visualizing Financial Performance
#Financial Plans and Performance #Diagram #Income Statement
