Sales Outlook Analysis Table – Focus on Market and Financial Performance
RM0600003_22
- Last Update 02/23/2025
- File Size 0.3MB
- # of Slides 2
- File Format PPTX
- Slide Ratio 16:9
- Color
Keywords
- #Content-Based Slides
- #Design-Based Slides
- #Market and Competitor Analysis
- #Financial Plans and Performance
- #Diagram
- #Graph
- #Future Outlook
- #Sales and Revenue
- #Table
- #Horizontal Bar
- #Segmented Horizontal Bar
- #16:9
- #horizontal bar chart PowerPoint
- #sales projections slide
- #data comparison template
- #financial analysis chart
- #how to create bar chart in PowerPoint
About the Product
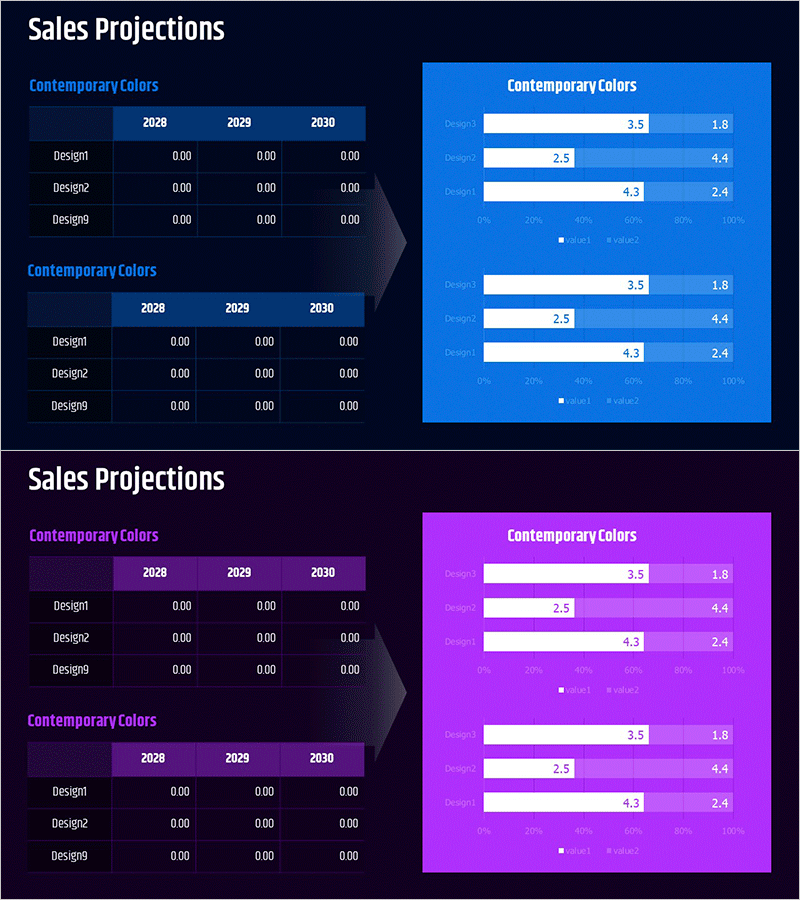
A horizontal bar chart PowerPoint slide for visualizing sales projections and market performance data. The design features blue and purple gradient backgrounds with white bars representing three data items across two series. Each slide is structured to compare financial metrics, making it ideal for financial planning, market analysis, and performance reports. Provided in 16:9 widescreen PPTX format with fully editable text and numerical values for immediate customization.
Usage Points
-
Main Usage
Compares three data items across two series using horizontal bar charts, perfect for visualizing sales projections, market performance, and financial metrics. The side-by-side bar layout enables clear year-over-year, departmental, or scenario-based comparisons.
-
How to Use
Use in business plans, investor pitch decks, quarterly earnings reports, and marketing strategy presentations to communicate financial data and market insights persuasively. The intuitive bar length comparison helps audiences quickly grasp performance differences.
-
Recommended For
CFOs, financial analysts, marketing managers, and business development professionals presenting quarterly or annual performance metrics. Suitable for investor presentations, internal management briefings, and client-facing performance reviews.
-
Slide Structure
Two-slide set featuring horizontal bar charts with three design variations (Design1, Design2, Design3). Blue and purple background versions each display dual-series data (value1 and value2) in a comparative layout, with fully customizable labels and values.
Related Products
-

Sales Outlook Comparison Analysis Chart – Market Analysis and Performance
#Market and Competitor Analysis #Financial Plans and Performance #Diagram
-

Sales Outlook Analysis Chart – Sleek Data Visualization
#Market and Competitor Analysis #Financial Plans and Performance #Diagram
-

Sales Outlook Table & Bar Chart – Market and Financial Insights
#Market and Competitor Analysis #Financial Plans and Performance #Diagram
-

Sales Outlook Analysis Segmented Graph – Visualizing Financial Performance
#Financial Plans and Performance #Diagram #Graph
