Comparison Chart of Product Performance by Year – Market and Competitiveness Analysis
RM0600003_13
- Last Update 02/23/2025
- File Size 0.3MB
- # of Slides 2
- File Format PPTX
- Slide Ratio 16:9
- Color
Keywords
- #Content-Based Slides
- #Design-Based Slides
- #Business Strategy
- #Market and Competitor Analysis
- #Diagram
- #Graph
- #Production Plan
- #Market Analysis
- #Table
- #Horizontal Bar
- #Grouped Horizontal Bar
- #16:9
- #horizontal bar chart PowerPoint
- #year-over-year comparison slide template
- #product performance analysis presentation
- #dual-series chart template
- #market analysis PowerPoint slide
About the Product
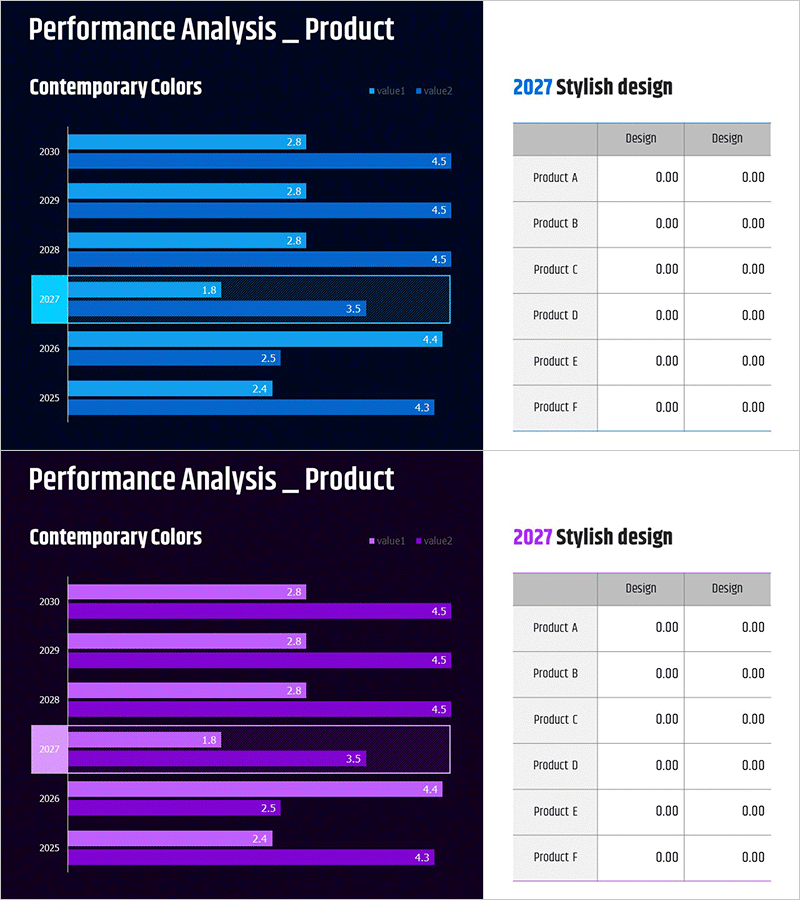
A horizontal bar chart PowerPoint slide for comparing product performance across years with dual data series. This presentation template visualizes 5-year performance data (2025–2030) for two value metrics side by side, enabling quick identification of annual trends and performance gaps between products. The cyan and black color scheme clearly differentiates data series, while numeric labels at each bar end facilitate precise value comparison. Ideal for business performance reports, market competitiveness analysis, product outcome presentations, and executive briefings requiring data-driven insights.
Usage Points
-
Main Usage
Designed to compare product performance metrics across two data series over a 5-year period, highlighting annual trends and performance variations. The horizontal bar layout maintains readability even with longer category names, while numeric labels enable precise value comparison and data-driven decision-making.
-
How to Use
Apply to business performance reports' results analysis sections, executive briefing materials for product outcome comparisons, marketing strategy documents for competitive positioning, investor presentations for annual growth visualization, and quarterly business reviews. Data values, labels, and colors are fully editable for customization.
-
Recommended For
Business strategists, marketing analysts, performance reporting managers, product managers, financial analysts, and executives who need to present year-over-year performance comparisons and competitive market analysis in professional presentations.
-
Slide Structure
2-slide template featuring horizontal bar charts with dual data series (value1 and value2) across 5 years (2025–2030). First slide uses cyan background; second uses purple background. Both include legend, year axis labels, numeric value labels, and are optimized for 16:9 widescreen format.
Related Products
-

Product Top Sales Analysis Graph – Market and Competitor Analysis
#Business Strategy #Market and Competitor Analysis #Diagram
-

Industry Trends and Market Analysis Charts - Bar and Column Graphs
#Company Introduction #Market and Competitor Analysis #Diagram
-

Product Performance Analysis Segmented Graph – Strengthening Market Competitiveness
#Business Strategy #Market and Competitor Analysis #Diagram
-

Sales Growth Rate and Profit Change Analysis Chart – Emphasizing Business Performance
#Business Strategy #Market and Competitor Analysis #Diagram
