Industry Trends and Market Analysis Charts - Bar and Column Graphs
RM0300001_17
- Last Update 02/06/2025
- File Size 0.4MB
- # of Slides 2
- File Format PPTX
- Slide Ratio 16:9
- Color
Keywords
- #Content-Based Slides
- #Design-Based Slides
- #Company Introduction
- #Market and Competitor Analysis
- #Diagram
- #Graph
- #Key Achievements
- #Market Analysis
- #Table
- #Horizontal Bar
- #Grouped Horizontal Bar
- #16:9
- #horizontal bar chart PowerPoint
- #vertical bar chart slide
- #bar graph template
- #industry trends chart
- #market analysis PowerPoint slide
About the Product
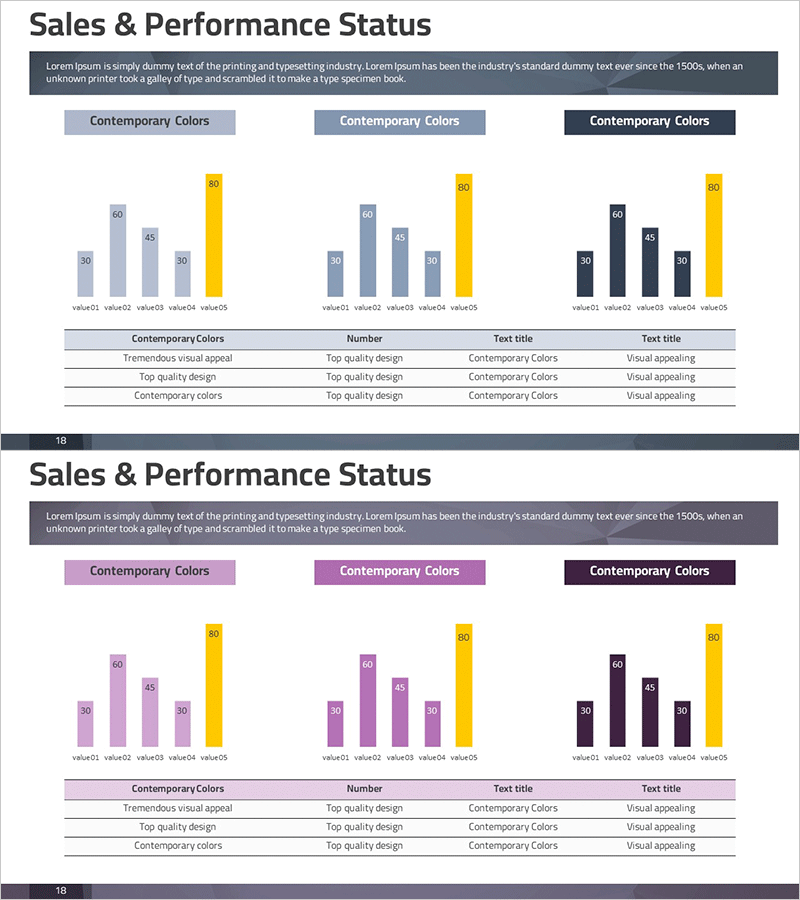
A 2-slide PowerPoint set featuring horizontal and vertical bar charts designed for industry trends and market analysis presentations. The slides utilize three color palettes: gray-blue, slate-blue, and navy-black combinations. Each slide displays five data items with yellow accent bars highlighting peak values or targets. The horizontal and vertical chart formats provide flexibility for different slide layouts and presentation structures. A data table legend and source attribution area are included on each slide, enabling immediate use in business reports and presentations without additional formatting.
Usage Points
-
Main Usage
Compare and analyze multiple numerical data points such as industry trends, market size, sales volume, and growth rates at a glance. Both horizontal and vertical chart formats are provided, allowing you to select the layout that best fits your presentation structure and page design.
-
How to Use
Double-click the data values on each slide to input your actual figures, and update the legend table with item names. The yellow accent bars represent peak values or targets and can be recolored as needed. Choose between horizontal or vertical format based on your presentation flow and content requirements.
-
Recommended For
Ideal for executive reports, business plans, marketing proposals, investor pitch decks, and quarterly or annual performance reports. Recommended for consulting firms, financial institutions, manufacturers, and retail companies that require data-driven decision-making presentations.
-
Slide Structure
Slide 1: Gray-blue color palette with 3-color horizontal bar chart, 5-item comparison, 1 yellow accent bar / Slide 2: Navy-black color palette with 3-color vertical bar chart, 5-item comparison, 1 yellow accent bar. Both slides include a data legend table and source attribution field at the bottom.
Related Products
-

Presentation Slide Visualizing Company Performance with Column Chart
#Company Introduction #Market and Competitor Analysis #Diagram
-

Year-by-Year Comparison Analysis Bundle Graph – Visualizing Market Performance
#Company Introduction #Market and Competitor Analysis #Diagram
-

Performance Analysis Mixed Graphs & Tables – Efficient Data Visualization
#Company Introduction #Market and Competitor Analysis #Diagram
-

Future Outlook & Competitor Analysis Chart
#Company Introduction #Market and Competitor Analysis #Diagram
