Vertical Bar Chart for Growth Trends – Challenge and Achievement
RM0500011_9
- Last Update 11/07/2025
- File Size 5.7MB
- # of Slides 2
- File Format PPTX
- Slide Ratio 16:9
- Color
Keywords
- #Content-Based Slides
- #Design-Based Slides
- #Business Strategy
- #Market and Competitor Analysis
- #Graph
- #Achievements
- #Market Status
- #Other
- #Mixed Chart
- #16:9
- #hybrid chart PowerPoint
- #bar and line graph template
- #dual-axis chart slide
- #growth trend visualization
- #business performance data slide
- #how to create hybrid charts in PowerPoint
About the Product
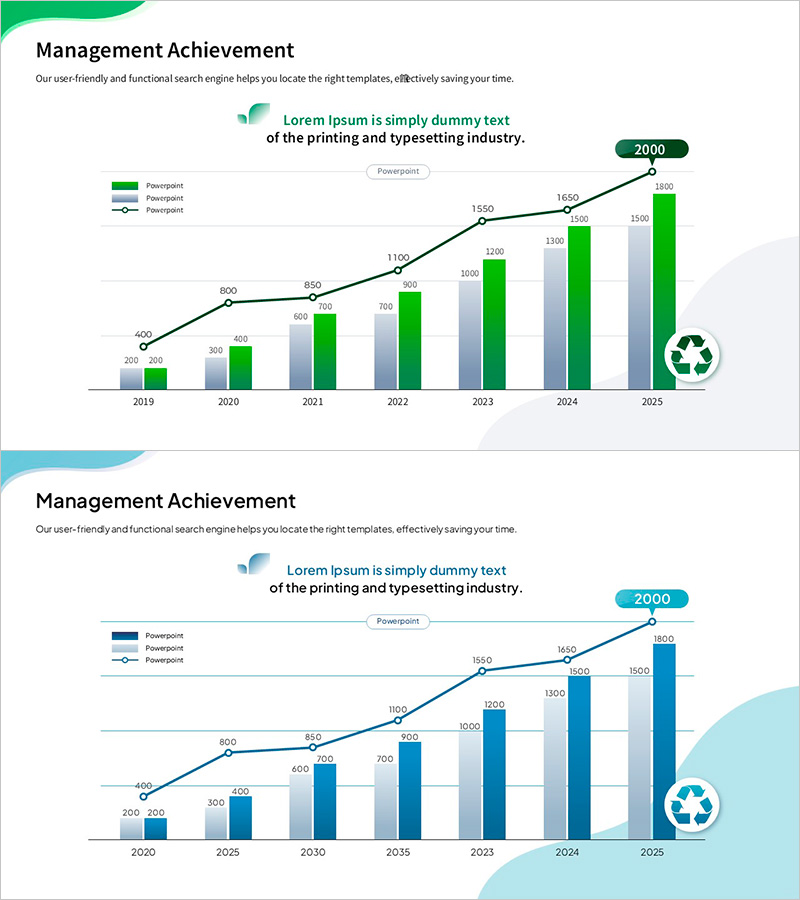
A hybrid chart PowerPoint slide that visualizes both business achievements and cumulative trends simultaneously. Green vertical bars highlight key performance metrics while a black line graph overlays the growth trajectory across years 2019–2025. The dual-axis design allows viewers to compare absolute values and trend direction in a single view. Includes a target badge (2000) in the upper right and a recycling icon symbolizing sustainability. Delivered as a 16:9 widescreen, 2-slide PPTX template with fully editable data fields that auto-update the chart upon input modification.
Usage Points
-
Main Usage
Designed for annual performance reports, business plan presentations, investor pitch decks, and executive briefings where multiple data series must be communicated effectively. The combination of bar and line elements enables audiences to grasp both absolute performance scale and directional momentum in a single visual.
-
How to Use
Double-click the data table embedded in the slide to input your actual figures; the chart updates automatically. Modify legend colors and labels to match your document branding. Extend or compress the year range to represent different time periods, and adjust axis scales to fit your data range.
-
Recommended For
Finance and operations teams presenting quarterly or annual results; marketing teams analyzing campaign ROI; strategy teams tracking long-term goal achievement; C-suite executive reports; shareholder meeting presentations. Ideal when quantitative outcomes and trend momentum must both be emphasized.
-
Slide Structure
Two-slide template: Slide 1 features a green-toned vertical bar chart (7 years, 2–3 data series per year) with a black trend line on a dual-axis layout; target badge (2000) and recycling symbol positioned upper right. Slide 2 repeats the same structure in blue tones, offering a color variant option for visual variety.
Related Products
-

Youth Employment Status Data Infographic – Market Analysis and Strategy
#Business Strategy #Market and Competitor Analysis #Diagram
-

Rainbow Paper Presentation Template Column Chart1 – Visualizing Market Trends
#Business Strategy #Market and Competitor Analysis #Graph
-

Healthy Food Ingredients and Area Charts
#Business Strategy #Market and Competitor Analysis #Graph
-

Comparative Mixed Graph – Market and Competitor Analysis
#Market and Competitor Analysis #Graph #Market Status
