Comparative Mixed Graph – Market and Competitor Analysis
RJ0500044_6
- Last Update 06/19/2025
- File Size 0.3MB
- # of Slides 2
- File Format PPTX
- Slide Ratio 16:9
- Color
Keywords
- #Content-Based Slides
- #Design-Based Slides
- #Market and Competitor Analysis
- #Graph
- #Market Status
- #Market Analysis
- #Column
- #Other
- #Grouped Column
- #Mixed Chart
- #16:9
- #mixed chart PowerPoint
- #bar and line graph slide
- #dual data comparison
- #market analysis chart
- #competitor analysis PowerPoint
- #composite data visualization slide
About the Product
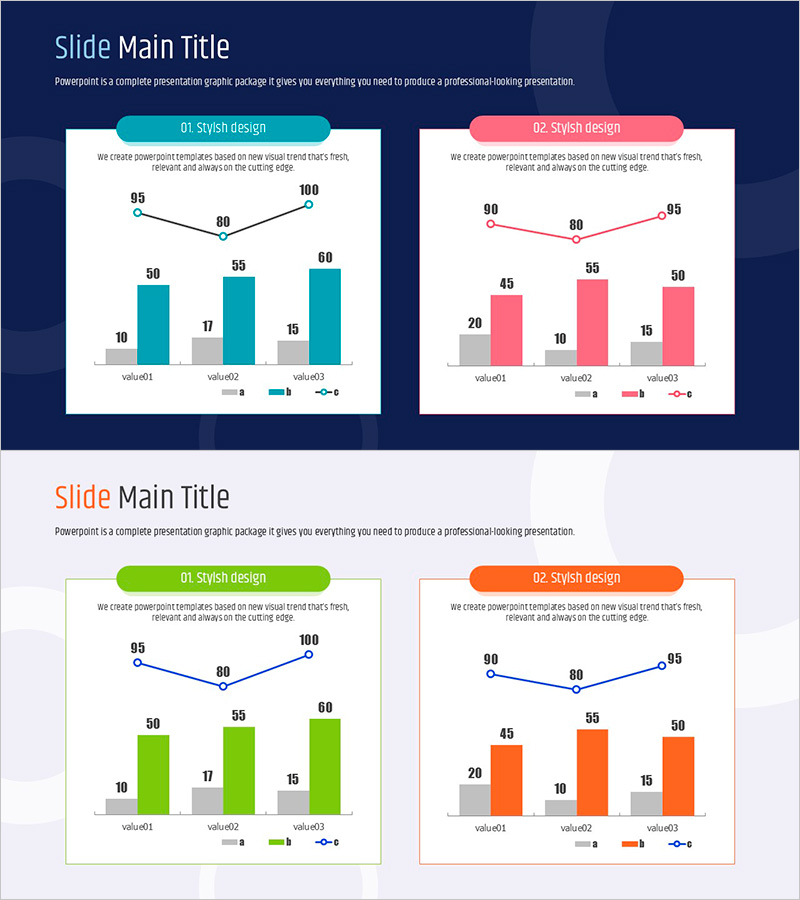
A mixed chart PowerPoint slide optimized for market analysis and competitor comparison. This template combines bar graphs and line graphs to display two different data series simultaneously. Available in teal and pink color schemes, each slide contains three data items with numerical values and trend lines. Instantly applicable for presentations and reports where you need to visualize complex data clearly and professionally.
Usage Points
-
Main Usage
Display two different data series side-by-side using bar and line graph combination to compare metrics with different units or characteristics. Effectively communicate market size versus growth rate, sales volume versus profitability, or competitor market share versus growth trends in a single view.
-
How to Use
Select color scheme using the style label (01 or 02) at the top of the slide. Modify bar heights and line graph data points to input your actual figures. Update legend and axis labels, then insert into your presentation or report.
-
Recommended For
Executive reports, business plans, marketing analysis documents, investor pitch decks, quarterly earnings presentations, competitive analysis reports, market research findings, and any situation requiring multi-metric comparison.
-
Slide Structure
Two-slide set. Each slide features a teal or pink header area, three-item bar graph with gray and primary color series, line graph at top showing trend (95→80→100 or 90→80→95), and legend with data labels.
Related Products
-

Start of the Challenge Vertical Bar Graph – Market Analysis
#Market and Competitor Analysis #Graph #Market Status
-

Market Analysis and Status Graph Slide – Harmony of Green and Orange
#Market and Competitor Analysis #Graph #Market Status
-

Touch Wide Slide Template – Column Chart & Table
#Market and Competitor Analysis #Diagram #Graph
-

Market Analysis Vertical Bar Graph
#Market and Competitor Analysis #Graph #Market Status
