Financial Status and Revenue Structure Analysis Chart – Business Insights
RM0500010_7
- Last Update 02/23/2025
- File Size 0.5MB
- # of Slides 2
- File Format PPTX
- Slide Ratio 16:9
- Color
Keywords
- #Content-Based Slides
- #Design-Based Slides
- #Business Introduction
- #Market and Competitor Analysis
- #Diagram
- #Graph
- #Market Analysis
- #Table
- #Horizontal Bar
- #Standard Table
- #Horizontal Bar Chart
- #16:9
- #horizontal bar chart PowerPoint
- #vertical bar chart presentation
- #financial status slide
- #revenue structure analysis chart
- #business data visualization
About the Product
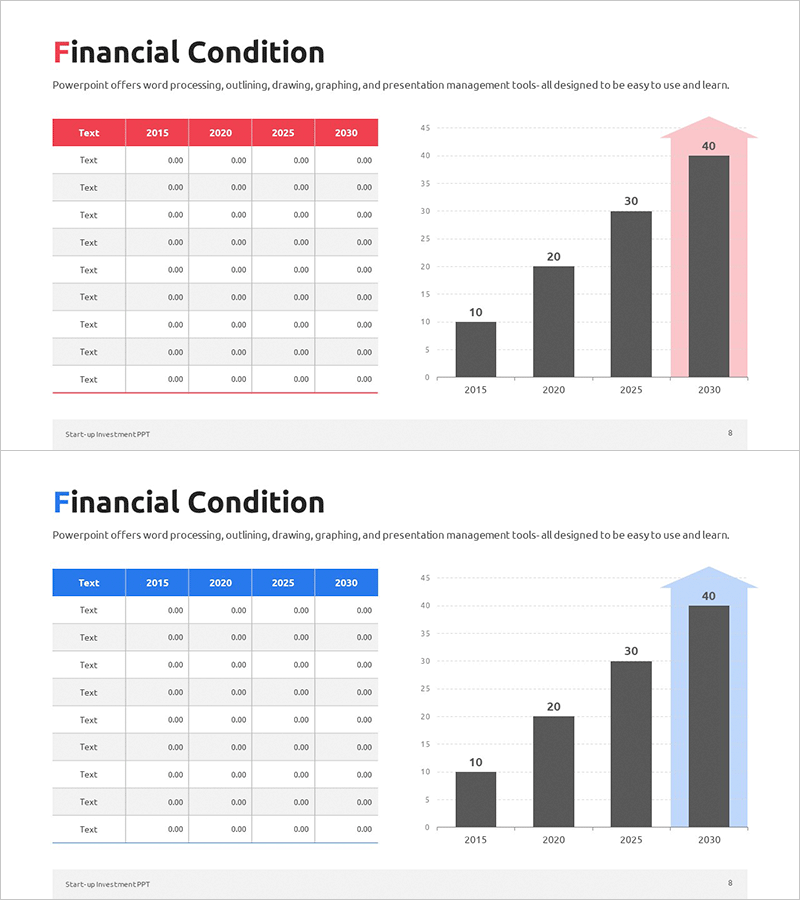
A 2-slide PowerPoint presentation set for visualizing financial status and revenue structure analysis. The first slide combines a data table with horizontal bar charts to compare financial metrics across 2015 to 2030 by year. The second slide presents the same dataset using vertical bar charts to highlight trend changes intuitively. Available in two color schemes—red and blue—allowing customization to match corporate branding. Delivered in 16:9 widescreen PPTX format, fully editable for immediate use in presentations.
Usage Points
-
Main Usage
Clearly communicate corporate financial performance and revenue structure changes through quantitative data visualization. Ideal for investor reports, business plan presentations, and financial analysis materials requiring year-over-year comparison. Combined table and chart presentation enhances credibility.
-
How to Use
Enter actual financial figures into the data table on the first slide; values automatically populate the horizontal bar chart. The second slide displays identical data as vertical bars for emphasis on trends. Color schemes (red/blue) are fully customizable to match corporate identity guidelines.
-
Recommended For
CFOs, finance managers, and executives presenting financial status in shareholder meetings or board presentations. Suitable for startup pitch decks, quarterly earnings reports, and consulting firm financial analysis documents.
-
Slide Structure
Slide 1: 5×5 data table (2015–2030 annual metrics) + 4-step horizontal bar chart (10→20→30→40 progression). Slide 2: Same data represented as 4-step vertical bar chart. Both slides include editable title area, legend, and axis labels.
Related Products
-

Key Financial Indicators and Growth Outlook – Optimized Graphs for Investment Proposals
#Business Introduction #Market and Competitor Analysis #Diagram
-

Cement Theme Bar Graph & Table
#Market and Competitor Analysis #Diagram #Graph
-

Cell Phone Mockup Bar Graph – Market Analysis and Technology Status
#Business Introduction #Market and Competitor Analysis #Graph
-

Sugar Content Analysis Bar Graph Table
#Market and Competitor Analysis #Diagram #Graph
