Cell Phone Mockup Bar Graph – Market Analysis and Technology Status
RJ0300054_13
- Last Update 05/02/2025
- File Size 2.9MB
- # of Slides 2
- File Format PPTX
- Slide Ratio 16:9
- Color
Keywords
- #Content-Based Slides
- #Design-Based Slides
- #Business Introduction
- #Market and Competitor Analysis
- #Graph
- #Other
- #Technological Status
- #Market Analysis
- #Horizontal Bar
- #Horizontal Bar Chart
- #Mockup
- #16:9
- #smartphone mockup PowerPoint
- #mobile device mockup slide
- #horizontal bar chart template
- #market analysis PPT slide
- #device mockup presentation template
About the Product
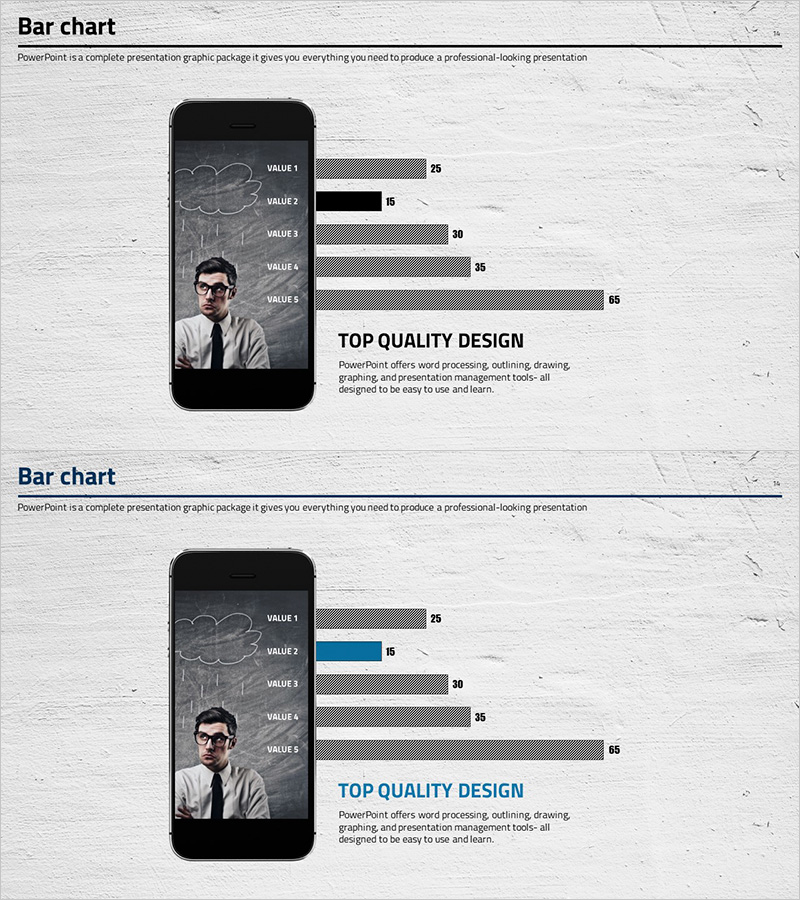
A 2-slide PowerPoint presentation combining a smartphone device mockup with a 5-item horizontal bar chart. The design features a minimalist gray and black background with a clear separation between the mobile device display area on the left and the data visualization section on the right. Each bar represents values ranging from 25 to 65, making it ideal for market analysis, technology trends, and competitive benchmarking in business presentations. Provided in 16:9 widescreen PPTX format with fully editable elements—colors, values, and labels can be customized to match your specific data and branding requirements.
Usage Points
-
Main Usage
Designed for mobile app and service pitch presentations where market size, user statistics, and technology performance need to be compared within a smartphone context. The device mockup reinforces product relevance while the bar chart provides quantitative evidence.
-
How to Use
Insert app screenshots or UI images into the left smartphone mockup area, then update the bar labels and values with your own data. Use the blue accent bar to highlight key metrics, and customize the title and descriptive text to match your presentation narrative.
-
Recommended For
Startup and IT company investment pitches, mobile app developer market analysis reports, telecom and fintech user statistics presentations, marketing team mobile trend analysis, and technology adoption benchmarking slides.
-
Slide Structure
Two-slide layout: Slide 1 features a gray background with left-aligned smartphone mockup (black border) and right-aligned 5-item horizontal bar chart (VALUE 1–5 with values 25, 15, 30, 35, 65). Slide 2 presents the same layout with a blue accent bar for emphasis, enabling metric highlighting and comparative visualization.
Related Products
-

Online Shopping Mall Composition Analysis Graph - Business Analysis and Technical Insights
#Business Introduction #Market and Competitor Analysis #Graph
-

Comparison Graph of Major Shopping Areas – Market Trends Analysis
#Business Introduction #Market and Competitor Analysis #Graph
-

Chart of Industry Change and Global Market Outlook Analysis
#Market and Competitor Analysis #Graph #Market Analysis
-

Market Trend Analysis Chart – Effective Data Visualization
#Market and Competitor Analysis #Graph #Market Analysis
