Company Financial Status Analysis Chart – Vision for Business Growth
RM0500008_7
- Last Update 02/22/2025
- File Size 1.3MB
- # of Slides 2
- File Format PPTX
- Slide Ratio 16:9
- Color
Keywords
- #Content-Based Slides
- #Design-Based Slides
- #Business Introduction
- #Market and Competitor Analysis
- #Diagram
- #Graph
- #Market Analysis
- #Table
- #Line
- #Standard Table
- #Line Chart
- #16:9
- #line chart PowerPoint
- #financial analysis slide template
- #trend graph presentation
- #business growth chart
- #multi-series line graph PowerPoint
About the Product
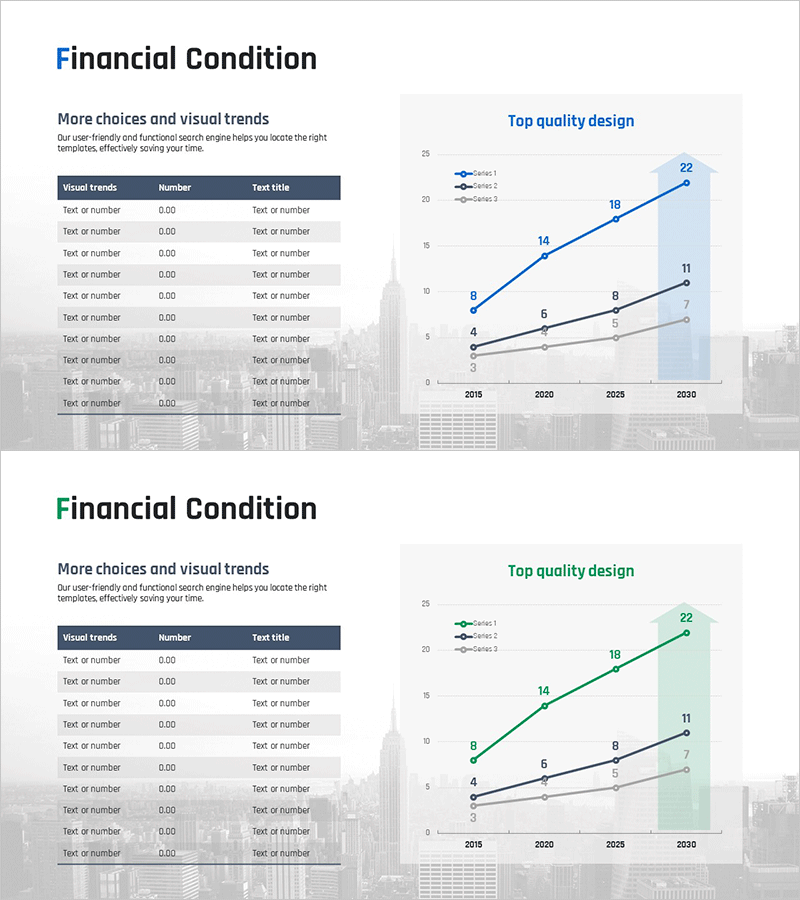
A line chart PowerPoint slide that visualizes company financial status over time with three data series from 2015 to 2030. The slide uses blue, black, and gray lines to clearly compare business growth trends and financial performance metrics. Includes a data table on the left side with visual trend information, making it ready for immediate use in financial reports, market analysis presentations, and business performance reviews. Delivered in 16:9 widescreen format with 2 slides for seamless integration into your presentation deck.
Usage Points
-
Main Usage
Visualize company financial status changes over time using a line chart to instantly communicate business growth trends. The three data series enable side-by-side comparison of multiple financial indicators, delivering a compelling narrative to executives, investors, and stakeholders about your company's financial performance and future outlook.
-
How to Use
Insert this slide into financial reports, business plans, and investor pitch decks in the financial section. The left-side data table is linked to the right-side chart, so updating numbers automatically refreshes the visualization. Ideal for displaying annual results, quarterly performance, revenue forecasts, and other time-series financial data.
-
Recommended For
CFOs, finance managers, and executives presenting financial performance. Also valuable for marketing teams showing market share evolution or customer satisfaction trends, and strategy teams illustrating business growth scenarios. Particularly suited for consulting, finance, manufacturing, and IT industries where data-driven decision-making is critical.
-
Slide Structure
Two-slide set with the first emphasizing blue series and the second highlighting green series. Each slide features a 'Visual Trends' data table (11 rows × 3 columns) on the left and a line chart on the right. The chart displays four time points (2015, 2020, 2025, 2030) across three lines with numeric labels at each data point for precise value reference.
Related Products
-

Green Yellow Data Analysis Chart – Market and Competitive Analysis
#Business Introduction #Market and Competitor Analysis #Diagram
-

Key Financial Indicators and Growth Outlook – Optimized Graphs for Investment Proposals
#Business Introduction #Market and Competitor Analysis #Diagram
-

Black Navy Broken Line Graph Table – Market and Competitor Analysis
#Market and Competitor Analysis #Diagram #Graph
-

Business Status and Market Analysis Doughnut Slide – Harmony of Blue and Orange
#Business Introduction #Market and Competitor Analysis #Diagram
