Year-by-Year Income Statement Chart – Financial Performance Analysis
RM0500010_25
- Last Update 02/22/2025
- File Size 0.5MB
- # of Slides 2
- File Format PPTX
- Slide Ratio 16:9
- Color
Keywords
About the Product
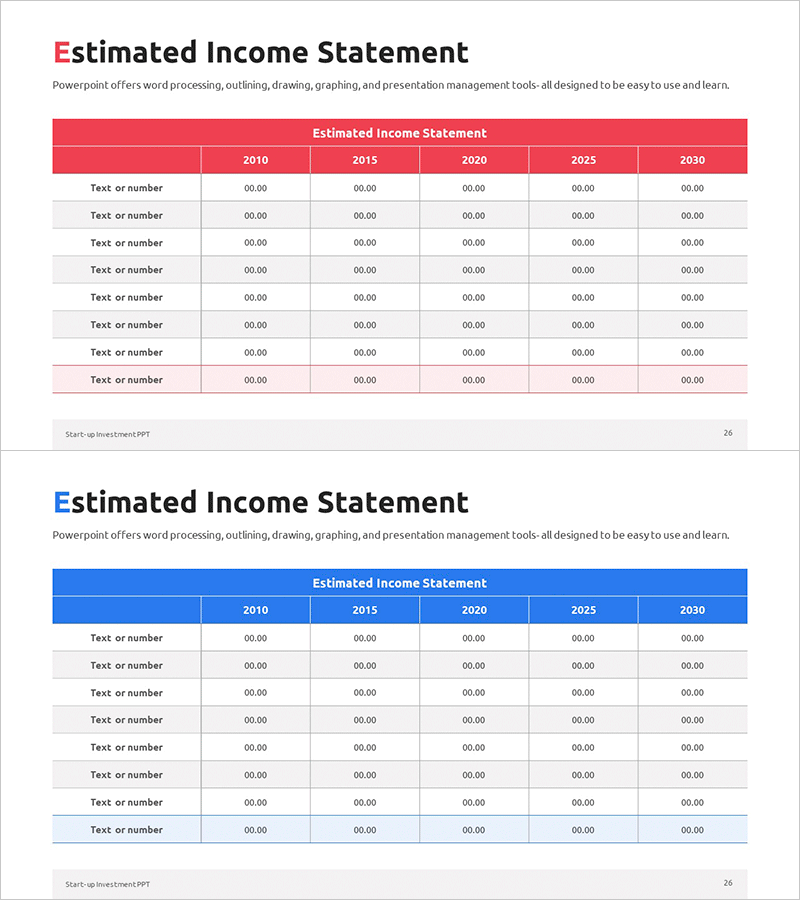
A professional income statement PowerPoint slide designed to compare financial performance across five years. Available in two color schemes—red and blue—this slide features a structured table format where users can input annual financial data from 2010 to 2030. Each row is labeled 'Text or number' for flexible editing, allowing you to enter revenue, expenses, and profit figures. Ideal for investor presentations, financial reports, and business plans that require clear visualization of revenue trends and profitability analysis.
Usage Points
-
Main Usage
Visualize annual financial performance (revenue, expenses, profit) in a time-series format to clearly communicate financial health and growth trends to investors, board members, and financial institutions.
-
How to Use
Enter financial line items (revenue, cost of goods sold, operating expenses, net income) in the row labels, then input corresponding year-by-year figures in the five year columns. Select your preferred color scheme (red or blue) to match your corporate branding.
-
Recommended For
CFOs, finance managers, and IR teams use this slide for investor presentations, quarterly financial reports, business plans, and bank loan applications. Highly suitable for startup fundraising pitch decks and annual financial reviews.
-
Slide Structure
Two-slide set. Each slide contains a colored header (red or blue) with title area and an 8-row by 5-column table. The first column displays financial line item names, while the remaining five columns provide data entry fields for years 2010, 2015, 2020, 2025, and 2030.
Related Products
-

Profit and Loss Statement Slide – Calculating Investment Business Sales and Profits
#Financial Plans and Performance #Diagram #Income Statement
-

Income Statement Table – Clear Visualization of Financial Performance
#Financial Plans and Performance #Diagram #Income Statement
-

Sales and Bills Slide for Navigation App
#Financial Plans and Performance #Diagram #Income Statement
-

Transportation Business Sales and Profit Table – Financial Analysis
#Financial Plans and Performance #Diagram #Income Statement
