Key Management Indicators and Performance Analysis Chart - Business Strategy
RM0500010_15
- Last Update 02/22/2025
- File Size 0.5MB
- # of Slides 2
- File Format PPTX
- Slide Ratio 16:9
- Color
Keywords
- #Content-Based Slides
- #Design-Based Slides
- #Business Strategy
- #Market and Competitor Analysis
- #Diagram
- #Graph
- #Achievements
- #Market Analysis
- #Table
- #Column
- #Grouped Column
- #16:9
- #grouped bar chart PowerPoint
- #management performance metrics slide
- #comparative data visualization
- #horizontal vertical bar graph
- #business analysis presentation template
About the Product
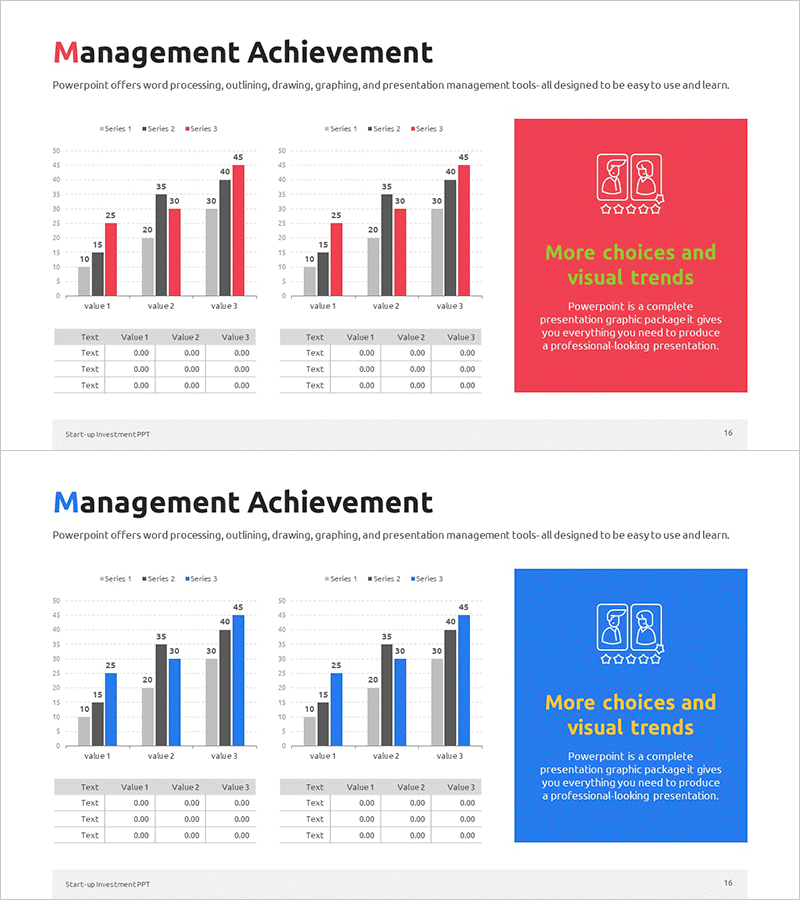
A grouped bar chart PowerPoint slide designed for visualizing management performance metrics and comparative analysis. This presentation template combines horizontal and vertical bar charts to display three data series simultaneously, with color-coded categories in red, blue, and gray tones optimized for business performance indicators. Each slide includes an editable data table below the charts, allowing immediate customization with actual figures. Perfect for business strategy presentations, quarterly performance reports, and departmental results analysis.
Usage Points
-
Main Usage
This slide enables multi-series comparison of management performance indicators and business results. The grouped bar format displays multiple data series side-by-side for the same categories, making trend comparison and ranking analysis straightforward. Ideal for executive presentations, quarterly performance reviews, departmental results reporting, and strategic business initiatives.
-
How to Use
Enter actual figures into the data table at the bottom of the slide, and the charts automatically update. Series colors (red, blue, gray) can be customized to match your corporate brand guidelines. Modify legend labels and axis titles to apply the template to different management metrics. Choose between horizontal or vertical bar format based on your presentation context.
-
Recommended For
Recommended for executives, business managers, financial analysts, marketing directors, and project managers who need to report quantitative performance data. Effective for quarterly earnings presentations, management meetings, investor reports, internal performance sharing, and data-driven decision-making scenarios.
-
Slide Structure
Two-slide layout with each slide displaying one horizontal bar chart on the left and one vertical bar chart on the right. Each chart shows three data series (Series 1, 2, 3) with distinct colors. Below each chart is a 4×4 editable data table for entering Value 1, 2, and 3 figures. Formatted in 16:9 widescreen ratio for optimal compatibility with modern projectors and digital displays.
Related Products
-

Arctic Market Future Outlook Bar Chart
#Business Strategy #Market and Competitor Analysis #Diagram
-

Sea Lighthouse Future Competitor Market Forecast Vertical Bar Graph
#Business Strategy #Financial Plans and Performance #Diagram
-

Touch Wide Slide Template – Column Chart & Table
#Market and Competitor Analysis #Diagram #Graph
-

Performance Analysis Table Slide – Market and Competitor Analysis
#Market and Competitor Analysis #Diagram #Graph
