Sea Lighthouse Future Competitor Market Forecast Vertical Bar Graph
RJ0600079_14
- Last Update 08/28/2025
- File Size 2.7MB
- # of Slides 2
- File Format PPTX
- Slide Ratio 16:9
- Color
Keywords
- #Content-Based Slides
- #Design-Based Slides
- #Business Strategy
- #Financial Plans and Performance
- #Diagram
- #Graph
- #Achievements
- #Sales and Revenue
- #Table
- #Column
- #Grouped Column
- #16:9
- #grouped vertical bar chart PowerPoint
- #comparison bar graph template
- #competitive analysis slide
- #market forecast chart
- #multi-series chart PowerPoint download
About the Product
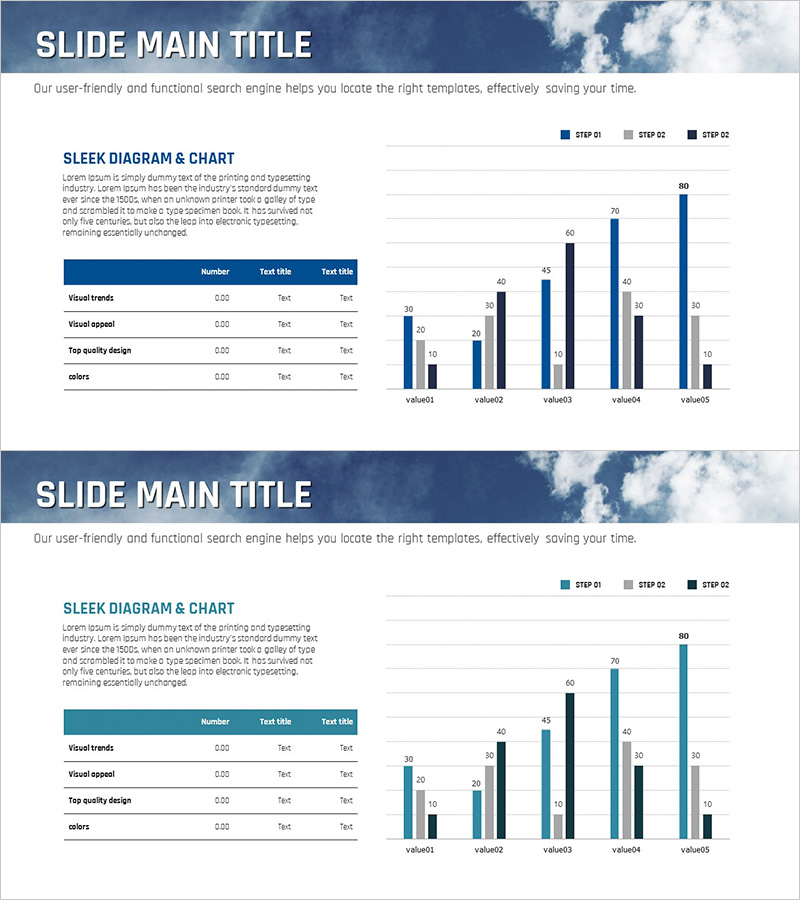
A grouped vertical bar chart PowerPoint slide optimized for competitive market forecast analysis. This presentation template displays numerical data across 5 items (value01 to value05) with 3 series (STEP 01, STEP 02, STEP 03) simultaneously, enabling clear visualization of competitor performance, market share, and forecast data in business strategy presentations. The navy, light blue, and gray color palette emphasizes professionalism, while the reference table at the top allows you to organize numerical legends for immediate use in reports. The 16:9 widescreen format with 2-slide composition adapts to various presentation environments.
Usage Points
-
Main Usage
Used to compare multiple series of numerical data—such as competitor performance, market share, and forecast figures—across the same items. The grouped structure enables intuitive comparison of differences between series, making it effective for strategy development and presenting decision-making evidence.
-
How to Use
Enter item names and numerical legends in the reference table at the top, then adjust bar heights and colors to match your data. During presentation, emphasize trends and gaps between series while explaining competitive situations and market opportunities. Additional items can be added by duplicating bars.
-
Recommended For
Recommended for strategy and planning team market analysis presentations, sales and marketing department competitive comparison materials, executive reports' market forecast sections, and investor relations presentations on market opportunities.
-
Slide Structure
2-slide composition. Each slide features a title and description area at the top, a 4-row reference table (item names and 3 series values) on the left-center, and a grouped vertical bar chart (5 items × 3 series) on the right. Bar heights range from 0 to 80, with the legend displayed in the upper right corner.
Related Products
-

KPI Target vs Actual Slide – 4-Metric Dark Red & Purple
#Company Introduction #Business Strategy #Financial Plans and Performance
-

Triangle Pattern Column Chart Presentation Template
#Market and Competitor Analysis #Financial Plans and Performance #Diagram
-

Volume Presentation Template with Tables and Clustered Charts – Efficient Data Analysis
#Market and Competitor Analysis #Financial Plans and Performance #Diagram
-

Key Management Indicators and Performance Analysis Chart - Business Strategy
#Business Strategy #Market and Competitor Analysis #Diagram
