Startup Investment Funding Plan Table – Blueprint Preparation
RM0500009_28
- Last Update 02/22/2025
- File Size 0.6MB
- # of Slides 2
- File Format PPTX
- Slide Ratio 16:9
- Color
Keywords
- #Content-Based Slides
- #Design-Based Slides
- #Financial Plans and Performance
- #Diagram
- #Capital Requirements
- #Income Statement
- #Table
- #16:9
- #funding plan table PPT slide
- #financial data table PowerPoint
- #investment plan table design
- #startup funding allocation slide
- #how to create a funding table in PowerPoint
About the Product
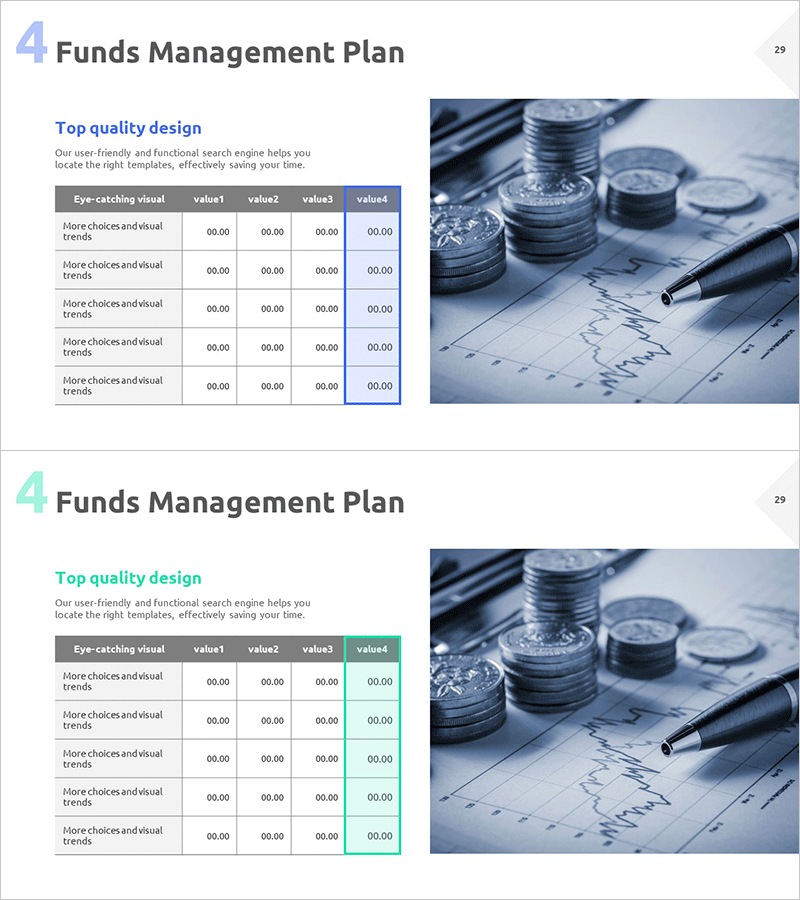
A financial data table PowerPoint slide designed to visualize investment and funding allocation plans. Featuring a blueprint background with financial imagery, this slide presents a structured 5-row by 4-column table layout ideal for startup investment pitches, investor relations materials, and business plan financial sections. The gray header row and white data cells create clear visual hierarchy for maximum readability of numerical data. The 16:9 widescreen format ensures compatibility with modern presentation environments. Two-slide set allows comparison of multiple financial scenarios and funding strategies.
Usage Points
-
Main Usage
This slide is optimized for presenting investment funding requirements and financial planning for startups and new business ventures. It enables clear communication of capital allocation amounts and purposes to investors, financial institutions, and executives. The structured table format supports comparison of multiple financial scenarios and budget allocation strategies.
-
How to Use
Enter funding categories (equipment, personnel, operations, etc.) in each row and populate the four columns with projected amounts, actual spending, variance rates, or cumulative totals. The blueprint background with financial imagery reinforces investment and finance credibility. The two-slide set allows side-by-side presentation of initial plans and revised projections.
-
Recommended For
Ideal for startup founders, CFOs, and finance managers preparing investor pitches, business plans, and financial reports. Particularly effective for presentations to venture capital firms, banks, and government funding agencies where systematic presentation of capital requirements and allocation is essential.
-
Slide Structure
The slide features a title area in the upper left and a main table section. The table comprises 5 rows (category header plus 4 data rows) and 4 columns (category label plus 3 value columns) in a 5×4 structure. Gray header row and white data cells establish clear visual hierarchy. Right side includes coins, pen, and chart imagery to reinforce financial theme.
Related Products
-

Green Brown Analysis Table – Visualizing Financial Planning
#Financial Plans and Performance #Diagram #Capital Requirements
-

Auto Business Funding Table – Maximizing Financial Efficiency
#Financial Plans and Performance #Diagram #Capital Requirements
-

Blue Green Table Slide – Visualizing Financial Performance
#Financial Plans and Performance #Diagram #Capital Requirements
-

Real Estate Business Fund Management Plan: Visualizing Financial Performance
#Financial Plans and Performance #Diagram #Capital Requirements
