Cafe Business Projected Income Statement Slide
RM0100021_19
- Last Update 01/31/2025
- File Size 3.8MB
- # of Slides 2
- File Format PPTX
- Slide Ratio 16:9
- Color
Keywords
- #Content-Based Slides
- #Design-Based Slides
- #Financial Plans and Performance
- #Diagram
- #Capital Requirements
- #Income Statement
- #Table
- #16:9
- #income statement PowerPoint slide
- #projected income statement template
- #financial data table slide
- #cafe business financial PPT
- #how to create income statement in PowerPoint
About the Product
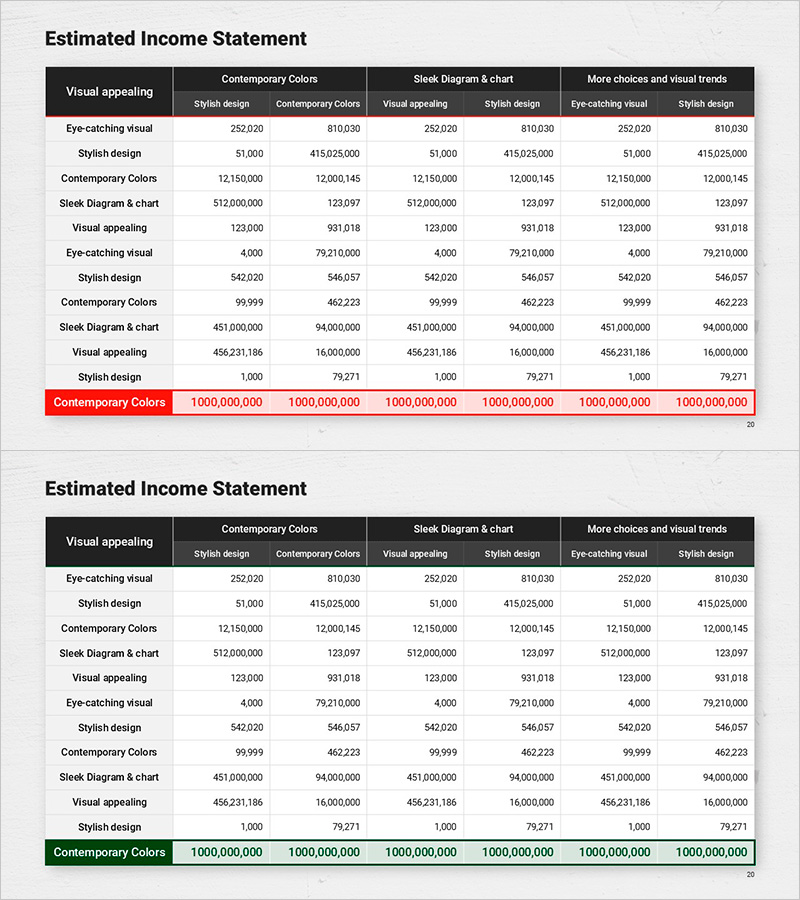
A PowerPoint slide visualizing a projected income statement for cafe business operations. The design features a black header with white background, creating clear contrast for financial data presentation. The 3-column structure enables scenario-based comparative analysis, making it ideal for investor presentations, business plans, and financial reports. The 2-slide set effectively communicates revenue, expenses, and profit margins through strategic color emphasis and numerical placement, supporting data-driven decision-making.
Usage Points
-
Main Usage
Visualizes projected income statements for business plans, investor pitches, and financial reports. The black header and white background contrast emphasizes financial figures, while the 3-column structure supports scenario comparison and financial forecasting.
-
How to Use
Input actual financial figures directly into the table structure for immediate use. Designed for small business financial planning, enabling quick comparison of projected revenue, expenses, and net profit across different scenarios or fiscal periods.
-
Recommended For
Entrepreneurs, small business owners, finance managers, and investment presenters. Particularly effective for cafe, restaurant, and retail business startups during business plan development to establish financial credibility.
-
Slide Structure
2-slide set with table format featuring row labels (line items) and 3 columns (scenarios or years). First slide presents key financial metrics (revenue, costs, profit), second slide shows detailed line-item breakdown. Color coding highlights critical financial indicators for quick analysis.
Related Products
-

Blue Green Table Slide – Visualizing Financial Performance
#Financial Plans and Performance #Diagram #Capital Requirements
-

Startup Investment Funding Plan Table – Blueprint Preparation
#Financial Plans and Performance #Diagram #Capital Requirements
-

Auto Business Funding Table – Maximizing Financial Efficiency
#Financial Plans and Performance #Diagram #Capital Requirements
-

Income Statement Table Chart
#Financial Plans and Performance #Diagram #Capital Requirements
