Income Statement Table Chart
RM0500010_28
- Last Update 02/22/2025
- File Size 5.7MB
- # of Slides 2
- File Format PPTX
- Slide Ratio 16:9
- Color
Keywords
- #Content-Based Slides
- #Design-Based Slides
- #Financial Plans and Performance
- #Diagram
- #Capital Requirements
- #Income Statement
- #Table
- #16:9
- #income statement PPT slide
- #financial table PowerPoint design
- #how to make an income statement in PowerPoint
- #profit and loss statement slide
- #financial data visualization template
About the Product
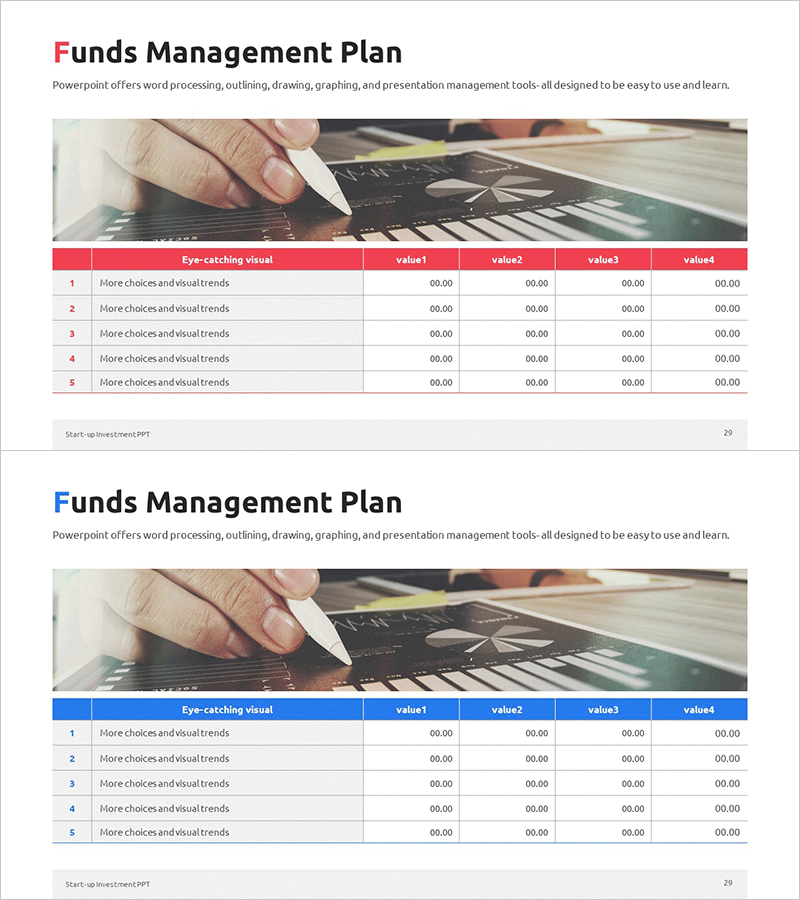
Essential PowerPoint slide for investment pitches, business plans, and financial reports. This income statement slide deck features two color themes—red and blue—with a structured table layout accommodating five financial line items (revenue, expenses, profit, etc.). Each slide presents numerical data in a clear, professional format that enables stakeholders to compare financial metrics at a glance. The table is fully editable, allowing you to input your company's actual figures and present financial performance with credibility.
Usage Points
-
Main Usage
Visualize your company's income statement and key financial metrics—revenue, cost of goods sold, operating income, taxes, and net profit—in a professional table format. This slide effectively communicates financial performance to investors, board members, employees, and business partners.
-
How to Use
Use in investor pitch decks, business plan financial sections, quarterly or annual financial reports, and executive briefings. Simply edit the row labels and numerical values to match your company's data, then select either the red or blue color theme to align with your overall presentation branding.
-
Recommended For
CFOs, finance managers, executives, startup founders, and investor relations professionals presenting financial results. Ideal for pitching to venture capital firms, banks, institutional investors, and stakeholders who require credible, data-driven financial transparency.
-
Slide Structure
Two-slide set. Each slide includes a title area (Income Statement), a banner image (hands working on financial documents), and a 5-row × 4-column financial data table. Slide 1 features a red header; Slide 2 features a blue header, giving you color flexibility to match your presentation theme.
Related Products
-

Startup Investment Funding Plan Table – Blueprint Preparation
#Financial Plans and Performance #Diagram #Capital Requirements
-

Green Brown Analysis Table – Visualizing Financial Planning
#Financial Plans and Performance #Diagram #Capital Requirements
-

Green Purple Funding Plan Table – Highlighting Financial Effectiveness
#Financial Plans and Performance #Diagram #Capital Requirements
-

Auto Business Funding Table – Maximizing Financial Efficiency
#Financial Plans and Performance #Diagram #Capital Requirements
