Blue Green Income Statement Analysis Table – Visualizing Financial Performance
RM0500009_25
- Last Update 02/22/2025
- File Size 0.5MB
- # of Slides 2
- File Format PPTX
- Slide Ratio 16:9
- Color
Keywords
- #Content-Based Slides
- #Design-Based Slides
- #Financial Plans and Performance
- #Diagram
- #Income Statement
- #Sales and Revenue
- #Table
- #16:9
- #income statement PowerPoint slide
- #financial data table presentation
- #revenue analysis PPT
- #5-year financial comparison slide
- #how to present financial statements in PowerPoint
About the Product
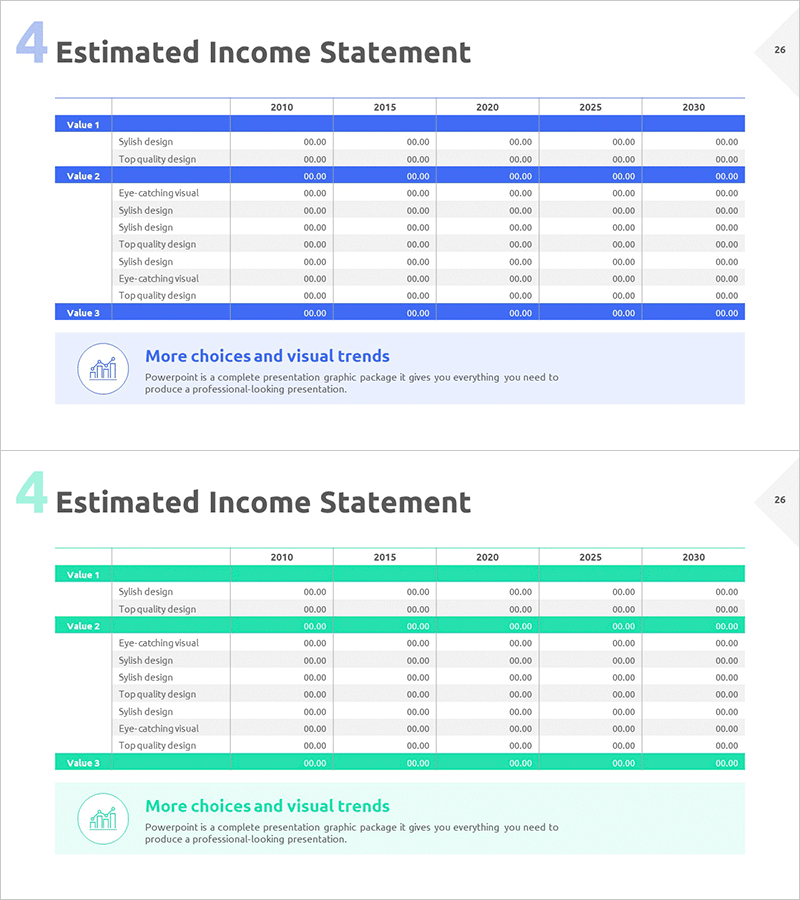
A professional income statement PowerPoint slide that visualizes financial performance through structured data comparison. The blue and green dual-tone table layout displays five-year financial metrics from 2010 to 2030 in clear, hierarchical rows. Three-tier value structure (Value 1, Value 2, Value 3) with detailed line items enables comprehensive analysis of revenue, expenses, and net income at a glance. This ready-to-use PPT slide is optimized for investor presentations, shareholder meetings, and executive financial reports, providing immediate credibility and clarity to financial communications.
Usage Points
-
Main Usage
Presents complex financial metrics in a structured, easy-to-read table format that supports data-driven decision-making. The three-tier value hierarchy (Value 1, Value 2, Value 3) organizes financial line items logically, while the five-year timeline enables trend analysis and performance tracking. This slide builds financial credibility with investors, shareholders, and executives by presenting data with professional clarity and visual hierarchy.
-
How to Use
Insert this slide into the financial section of investor decks, business plans, or quarterly earnings presentations. Replace placeholder values with actual revenue, operating expenses, and net income figures. Customize Value labels to match your financial categories (Revenue, COGS, Operating Income, etc.). Maintain the blue-green color scheme to reinforce financial trust and professionalism. Use the 'More choices and visual trends' section below the table for additional commentary or supplementary charts.
-
Recommended For
CFOs, financial analysts, IR professionals, and executives presenting to investors, shareholders, and board members. Suitable for startup pitch decks, public company earnings calls, management consulting reports, and financial advisory presentations. Works well for quarterly reviews, annual reports, and strategic financial planning sessions.
-
Slide Structure
The slide features a title area and a three-level data table. The header 'Estimated Income Statement' clearly identifies the slide purpose. The main table uses rows for value categories and line items (Value 1, Value 2, Value 3 with sub-items) and columns for fiscal years (2010, 2015, 2020, 2025, 2030). Each cell is formatted for numerical input (00.00 format). The bottom section 'More choices and visual trends' provides space for additional insights, footnotes, or supplementary visualizations.
Related Products
-

Sales and Profit Table Diagram
#Financial Plans and Performance #Diagram #Income Statement
-

Transportation Business Sales and Profit Table – Financial Analysis
#Financial Plans and Performance #Diagram #Income Statement
-

Sales and Profit Comparison Graph & Table – Clear Financial Analysis
#Financial Plans and Performance #Diagram #Graph
-

Sales and Bills Slide for Navigation App
#Financial Plans and Performance #Diagram #Income Statement
