Profit and Loss Statement Slide – Calculating Investment Business Sales and Profits
RJ0300096_16
- Last Update 05/16/2025
- File Size 0.3MB
- # of Slides 2
- File Format PPTX
- Slide Ratio 16:9
- Color
Keywords
- #Content-Based Slides
- #Design-Based Slides
- #Financial Plans and Performance
- #Diagram
- #Income Statement
- #Sales and Revenue
- #Table
- #16:9
- #profit and loss statement PowerPoint slide
- #financial data table presentation
- #P&L statement slide design
- #year-over-year financial comparison
- #how to create a P&L statement in PowerPoint
About the Product
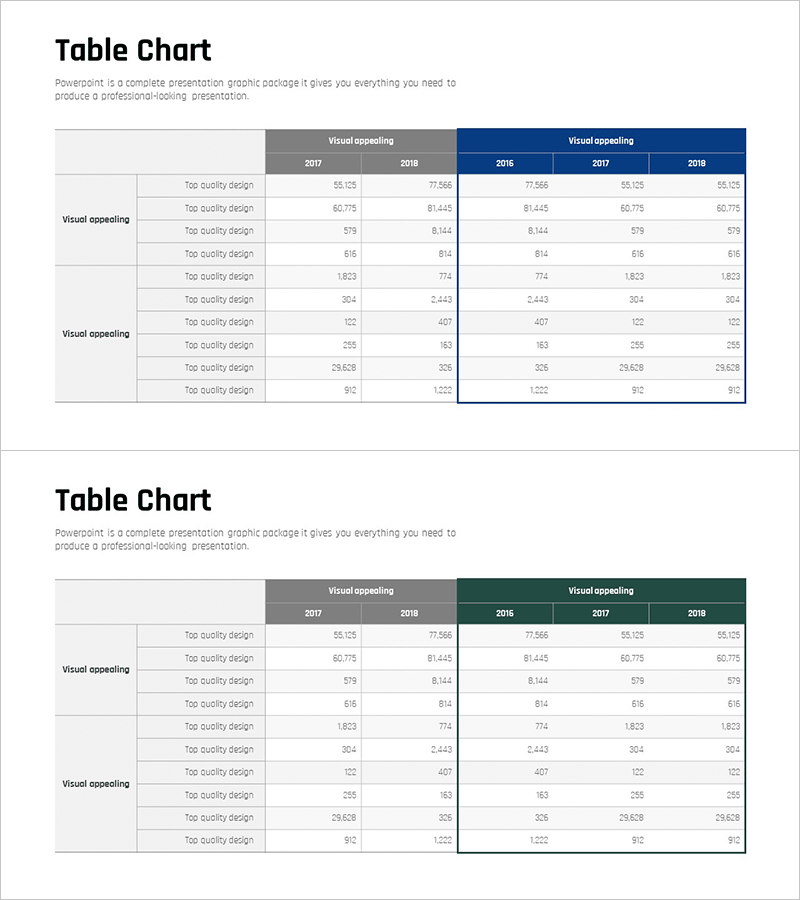
A comprehensive profit and loss statement PowerPoint slide set that visualizes investment business revenue and profitability with clarity and precision. This 2-slide collection features a structured table layout enabling year-over-year financial performance comparison. The design employs a gray header on the left and navy-green dual-tone data sections on the right, creating clear information hierarchy. Each slide organizes critical financial metrics—revenue, cost of goods sold, operating income, and net profit—across years (2017, 2018, 2019) in row-column format. Ready for immediate use in investor presentations, IR materials, and executive reports. Delivered in 16:9 widescreen PPTX format compatible with all presentation environments.
Usage Points
-
Main Usage
Visualize and compare critical financial metrics—revenue, cost of goods sold, operating income, and net profit—across multiple years. Present profit and loss data in a structured table format to communicate financial performance transparently and support strategic decision-making.
-
How to Use
Deploy in investor presentations, quarterly earnings reports, executive briefings, and financial analysis meetings. Replace placeholder numbers with actual financial data and use color highlighting to emphasize key performance indicators and trends.
-
Recommended For
CFOs, financial analysts, investor relations managers, and executives presenting financial performance. Ideal for startup pitch decks, public company earnings announcements, and corporate merger and acquisition negotiations.
-
Slide Structure
2-slide set. Each slide contains a title area, left-aligned gray header (year labels), and right-aligned data table (3-4 rows, 5 columns). Header displays 'Profit and Loss Statement' title; central table lists revenue, COGS, operating income, pre-tax income, and net income organized by fiscal year.
Related Products
-

Sales and Profit Table – Financial Performance Visualization
#Financial Plans and Performance #Diagram #Income Statement
-

Sales and Profit Calculation Table – Key to Profit Management
#Financial Plans and Performance #Diagram #Income Statement
-

Sales and Bills Slide for Navigation App
#Financial Plans and Performance #Diagram #Income Statement
-

Sales and Profit Table Diagram
#Financial Plans and Performance #Diagram #Income Statement
