Clustered Vertical Bar Comparison Analysis Chart – Visualization for Competitiveness
RM0500009_13
- Last Update 02/22/2025
- File Size 0.5MB
- # of Slides 2
- File Format PPTX
- Slide Ratio 16:9
- Color
Keywords
- #Content-Based Slides
- #Design-Based Slides
- #Market and Competitor Analysis
- #Diagram
- #Graph
- #Competitor Analysis
- #Market Analysis
- #Table
- #Column
- #Grouped Column
- #16:9
- #clustered vertical bar chart PowerPoint
- #competitor analysis chart
- #comparison analysis slide template
- #bar graph PPT download
- #market analysis presentation
- #3-series data visualization
About the Product
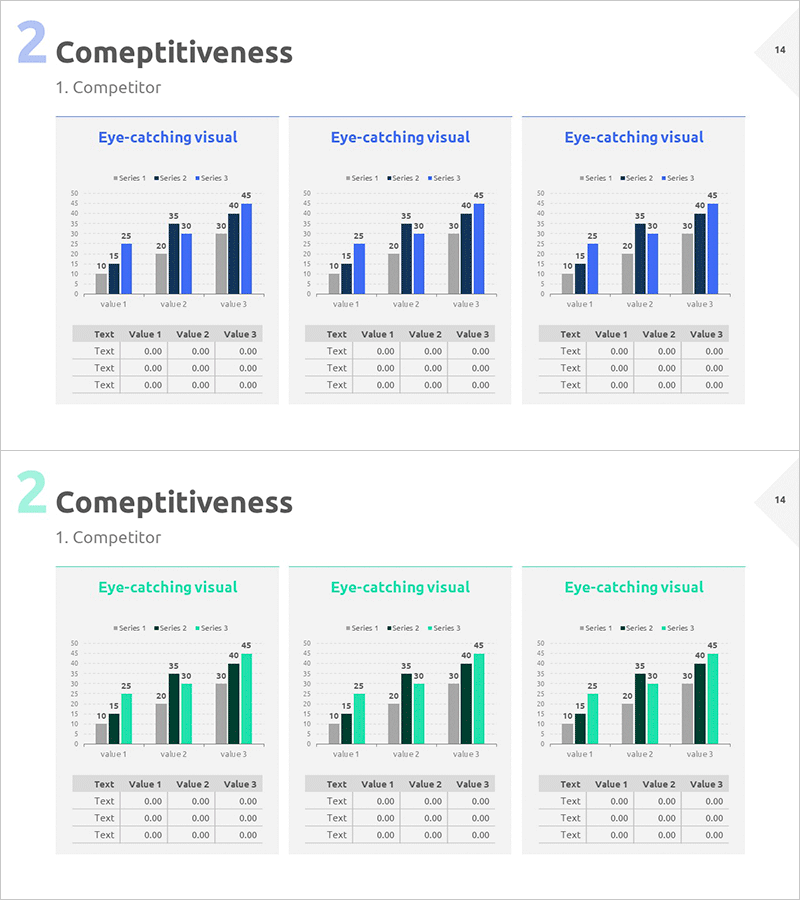
A clustered vertical bar chart PowerPoint slide optimized for competitive analysis and market comparison. Three data series are arranged side-by-side to display multiple competitors' performance metrics at a glance. The design features blue, gray, and dark blue color tones with clear numerical comparisons for each category. Includes a data table below the chart for easy reference. This presentation template is ready to use in business reports, competitive analysis decks, and executive presentations.
Usage Points
-
Main Usage
Compares competitor performance metrics across three data series to visualize competitive positioning. Ideal for displaying market share, revenue, customer satisfaction, or other KPIs simultaneously to highlight competitive advantages.
-
How to Use
Adjust bar heights to input actual data values and populate the data table below with corresponding figures. Use in presentation decks during competitive analysis sections or embed in business reports to enhance data credibility and decision-making clarity.
-
Recommended For
Marketing managers, strategy planners, sales directors, and executives preparing competitive analysis reports. Suitable for business plans, market analysis reports, competitive positioning presentations, and quarterly performance reviews.
-
Slide Structure
2-slide set. First slide features blue-toned 3-series bars comparing 3 values (value 1, 2, 3). Second slide uses green-toned bars with identical structure. Each slide includes a data input table with Text and Value 1, 2, 3 fields for customization.
Related Products
-

Competitor Comparison Analysis Graph - A Tool for Effective Market Analysis
#Market and Competitor Analysis #Diagram #Graph
-

3D Printing Market Analysis Graph
#Market and Competitor Analysis #Diagram #Graph
-

Note Illustration Theme Chart – Market Analysis and Competitor Insights Tool
#Market and Competitor Analysis #Diagram #Graph
-

Table chart & Clustered Column Graph – Market Analysis & Competitor Comparison
#Market and Competitor Analysis #Diagram #Graph
