Performance Analysis Table Slide – Market and Competitor Analysis
RJ0600100_25
- Last Update 07/18/2025
- File Size 0.4MB
- # of Slides 2
- File Format PPTX
- Slide Ratio 16:9
- Color
Keywords
- #Content-Based Slides
- #Design-Based Slides
- #Market and Competitor Analysis
- #Diagram
- #Graph
- #Competitor Analysis
- #Market Analysis
- #Table
- #Column
- #Standard Table
- #Grouped Column
- #16:9
- #grouped bar chart PowerPoint
- #market analysis slide template
- #competitor analysis chart
- #performance comparison graph
- #data visualization PowerPoint slide
About the Product
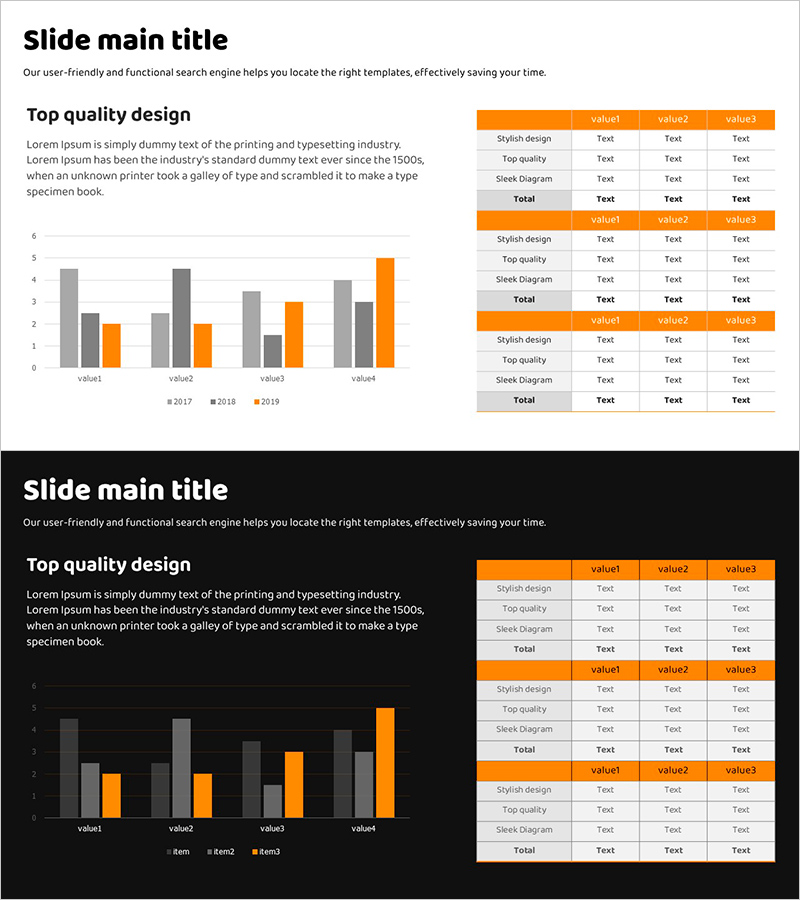
A grouped bar chart PowerPoint slide designed for market and competitor analysis presentations. This slide features a vertical bar chart comparing four data items (value1 through value4) across three years (2017, 2018, 2019) using gray and orange color schemes. An accompanying data table on the right side provides detailed numerical information and descriptions. The combination of visual chart representation and structured table layout makes this slide ideal for business reports, competitive benchmarking, and performance analysis in pitch decks and executive presentations.
Usage Points
-
Main Usage
This slide enables side-by-side comparison of multiple data series across time periods, making it ideal for presenting market trends, competitive benchmarks, and year-over-year performance metrics. The dual layout of chart and table ensures both visual clarity and numerical accuracy for data-driven decision making.
-
How to Use
Input your actual data values into the grouped bar chart on the left side, then populate the corresponding data table on the right with detailed figures and explanatory text. Use the orange accent color to highlight key performance indicators or the gray baseline to establish comparison benchmarks. During presentation, reference both the chart trends and table details to reinforce credibility and audience understanding.
-
Recommended For
Ideal for strategy planners, marketing managers, sales teams, financial analysts, and business development professionals. Perfect for quarterly business reviews, market analysis reports, investor pitch decks, executive briefings, and competitive positioning documents where data-driven insights are critical to stakeholder communication.
-
Slide Structure
2-slide set. Each slide features a grouped vertical bar chart on the left displaying 4 data items across 3 years, paired with a 3-row × 4-column data table on the right (rows: Stylish design, Top quality, Sleek Diagram, Total). 16:9 widescreen format, PPTX file type.
Related Products
-

Competitor Comparison Analysis Graph - A Tool for Effective Market Analysis
#Market and Competitor Analysis #Diagram #Graph
-

3D Printing Market Analysis Graph
#Market and Competitor Analysis #Diagram #Graph
-

Note Illustration Theme Chart – Market Analysis and Competitor Insights Tool
#Market and Competitor Analysis #Diagram #Graph
-

Table Chart & Clustered Column Graph – Market and Competitor Analysis
#Market and Competitor Analysis #Diagram #Graph
