Paper Theme Table Chart & Bar Graph – Market Analysis and Competitive Strength
RJ0300048_13
- Last Update 05/01/2025
- File Size 6.2MB
- # of Slides 2
- File Format PPTX
- Slide Ratio 16:9
- Color
Keywords
About the Product
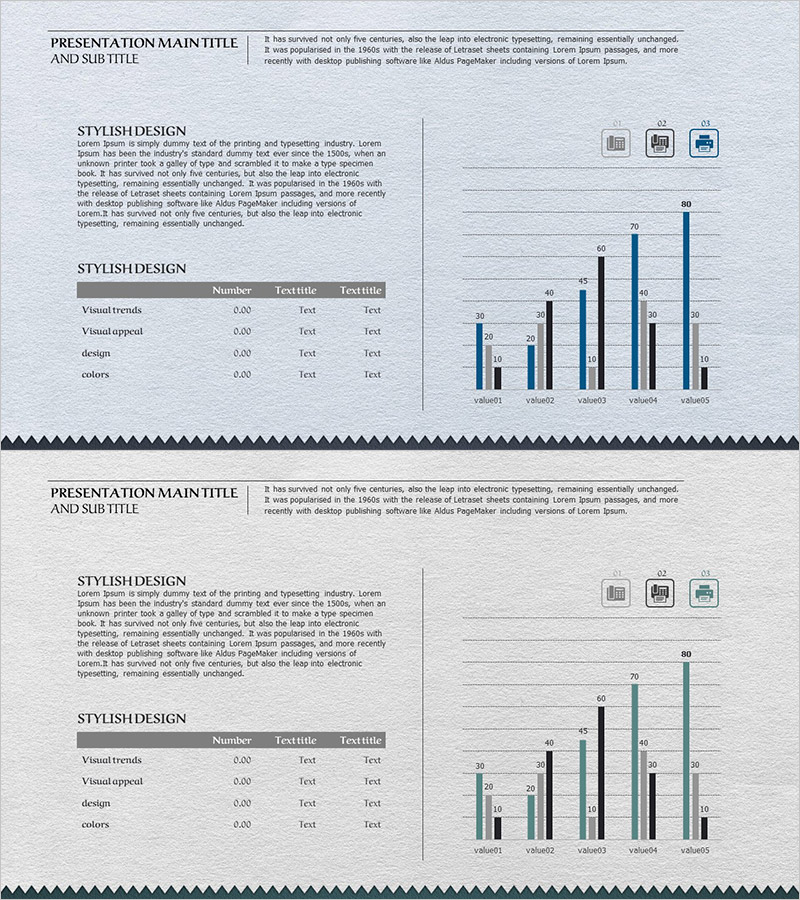
A 2-slide set designed with a minimalist paper theme aesthetic. The first slide features a 4-row by 3-column table chart organizing visual trends, visual appeal, design, and color categories. The second slide presents a grouped bar graph with 5 data series comparing values across 5 categories. The navy, light blue, and gray color palette creates a professional appearance suitable for business presentations. Both slides are fully editable in PowerPoint, allowing you to input your own data and customize the layout instantly.
Usage Points
-
Main Usage
Effectively visualize quantitative market analysis, competitive benchmarking, and sales performance data using both tabular and graphical formats. The table presents detailed figures while the grouped bar graph enables intuitive comparison of trends across multiple data series.
-
How to Use
Insert into business plans, marketing strategy documents, or quarterly performance reports in the market analysis section. Edit table cells and graph series colors using PowerPoint's native tools, then input your data for immediate deployment in presentations.
-
Recommended For
Marketing managers, business analysts, sales directors, and financial professionals presenting quarterly reports, strategic planning sessions, and executive briefings requiring data-driven insights and comparative analysis.
-
Slide Structure
Slide 1: 4-row × 3-column table with row headers (item names, metric 1, metric 2, metric 3) / Slide 2: Grouped bar graph with 5 data points (value01–value05) across 3 series (navy, light blue, gray), with numeric labels above each bar
Related Products
-

Table Chart & Clustered Column Graph – Market and Competitor Analysis
#Market and Competitor Analysis #Diagram #Graph
-

Performance Analysis Table Slide – Market and Competitor Analysis
#Market and Competitor Analysis #Diagram #Graph
-

Clustered Vertical Bar Comparison Analysis Chart – Visualization for Competitiveness
#Market and Competitor Analysis #Diagram #Graph
-

Competitor Comparison Analysis Graph - A Tool for Effective Market Analysis
#Market and Competitor Analysis #Diagram #Graph
