Blue Green Balance Sheet – Diagram for Financial Planning
RM0500008_26
- Last Update 02/22/2025
- File Size 0.3MB
- # of Slides 2
- File Format PPTX
- Slide Ratio 16:9
- Color
Keywords
About the Product
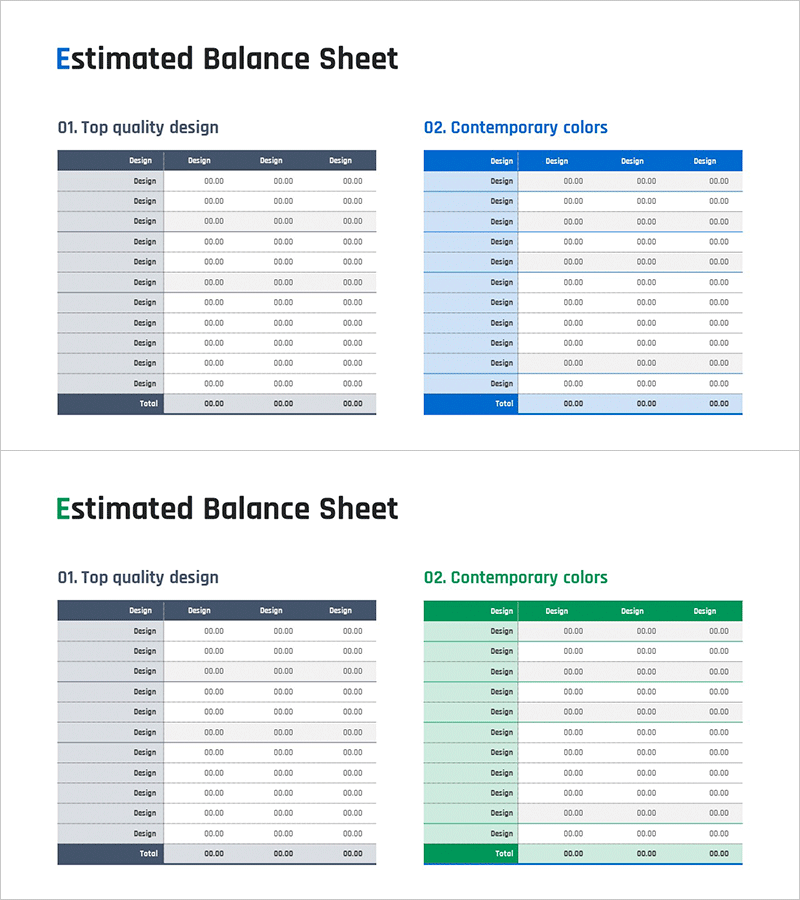
A professional balance sheet PowerPoint slide designed to clearly present financial statements. The slide features a blue and green dual-tone header that visually separates assets, liabilities, and equity sections, with dedicated data entry areas for each category. The 2-slide layout provides a clear division between title area and data table, enabling intuitive visualization of financial figures. Ready to use in investor presentations, financial reports, and business plan financial sections. Optimized for 16:9 widescreen format in modern presentation environments.
Usage Points
-
Main Usage
Systematically organize and clearly communicate financial position to investors and stakeholders. The blue-green header visually distinguishes assets, liabilities, and equity sections, allowing viewers to grasp financial structure at a glance.
-
How to Use
Insert into investor relations materials, financial reports, or business plan financial sections. Enter actual data into the designated input areas for immediate presentation use. The 16:9 widescreen format is ideal for large-screen presentations and modern conference rooms.
-
Recommended For
CFOs, financial managers, investor relations professionals, business plan authors, financial analysts, and executive reporting teams. Particularly effective for quarterly financial reviews, investor meetings, and executive briefings on financial performance.
-
Slide Structure
Composed of title area with blue-green dual-tone header and data table section below. The table is divided into three sections: assets, liabilities, and equity, each with dedicated numerical input cells. The 2-slide layout provides flexibility for presenting various financial data and comparative analysis.
Related Products
-

Estimated Balance Sheet Table – A Benchmark for Financial Planning
#Financial Plans and Performance #Diagram #Balance Sheet
-

Visualizing Financial Performance with Comparison Tables – Transparent Information Delivery
#Financial Plans and Performance #Diagram #Balance Sheet
-

Visualizing Financial Performance with a Pet Parrot Table Slide
#Financial Plans and Performance #Diagram #Balance Sheet
-

Gradient Table Presentation for Visualizing Financial Performance
#Financial Plans and Performance #Diagram #Balance Sheet
