Application Development Business Balance Sheet – Stylish Financial Presentation
RM0500007_26
- Last Update 02/21/2025
- File Size 3.1MB
- # of Slides 2
- File Format PPTX
- Slide Ratio 16:9
- Color
Keywords
- #Content-Based Slides
- #Design-Based Slides
- #Financial Plans and Performance
- #Diagram
- #Other
- #Balance Sheet
- #Key Financial Indicators
- #Table
- #16:9
- #balance sheet PowerPoint slide
- #financial data table presentation
- #how to create a balance sheet in PowerPoint
- #balance sheet template download
- #investment pitch financial statement
About the Product
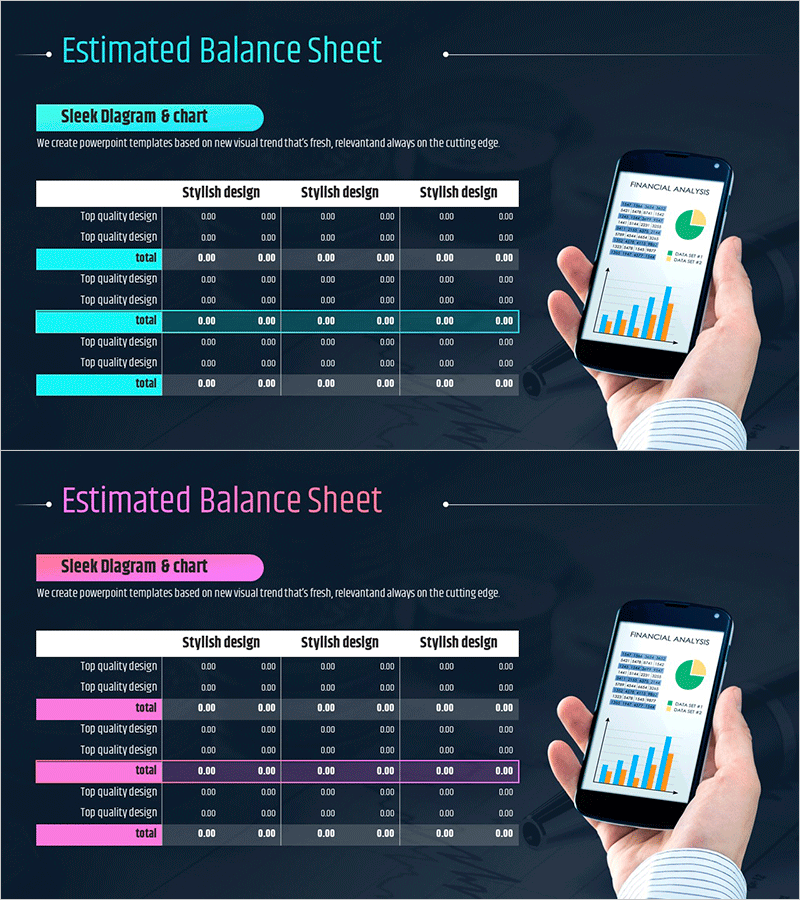
An essential balance sheet PowerPoint slide for financial presentations and investment pitches. Featuring a dark navy background with cyan accent lines across 2 slides, this template presents assets, liabilities, and equity items in a clear multi-column table format. Pre-designed input areas allow you to enter actual financial figures immediately, while a smartphone image on the right displays mobile financial analysis, reflecting modern digital finance. Ideal for business plans, investor relations materials, and financial reports to convey corporate financial health with confidence.
Usage Points
-
Main Usage
Visually present corporate financial position through a structured balance sheet slide. The three-column format (assets, liabilities, equity) enables clear comparison and analysis of financial figures. Designed to communicate financial stability and fiscal health to investors, financial institutions, and stakeholders with professional credibility.
-
How to Use
Insert this slide into the financial section of business plans, investor relations decks, and quarterly or annual financial reports. The cyan accent rows highlight key totals (total assets, total liabilities, total equity), so enter summary figures first, then populate detail line items. This top-down approach ensures clarity and visual hierarchy.
-
Recommended For
CFOs, finance managers, and executives presenting at investor conferences, shareholder meetings, and financial institution negotiations. Applicable across all company sizes—from startup business plans to mid-market quarterly reports to enterprise-level IR materials.
-
Slide Structure
2-slide set with multi-column table layout: 6 columns (stylish design categories) and 8–10 rows (asset, liability, equity detail items). Cyan-highlighted rows emphasize subtotals and totals, while the smartphone image on the right represents mobile financial analytics, reflecting contemporary digital finance practices.
Related Products
-

Origami Concept Table – Visualizing Financial Performance
#Financial Plans and Performance #Diagram #Balance Sheet
-

Sleek Diagram and Chart Design
#Financial Plans and Performance #Diagram #Balance Sheet
-

Visualizing Financial Performance with Standard Table Slide
#Financial Plans and Performance #Diagram #Balance Sheet
-

Botanic Garden Management Item Table – Financial Performance and Data Visualization
#Financial Plans and Performance #Diagram #Balance Sheet
